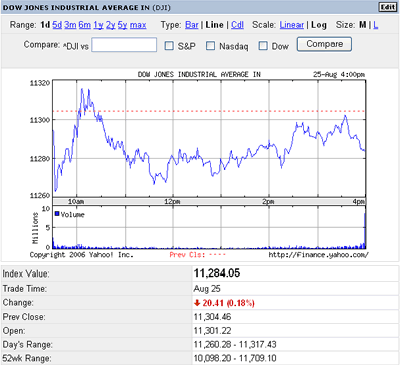
Markets were fairly active Friday morning, but died in the afternoon session. We saw a little bit of buying interest towards the end of the afternoon session, but nothing substantial enough to make up for the mornings losses. The Dow, S&P and NASDAQ closed lower.
US stock futures are suggested a flat for the most part this morning. There is no news on today's economic calendar. Tomorrow's Consumer Confidence numbers will likely move the market. The data is due to be release tomorrow morning at 10:00 a.m. ET.
The yield on the 10-year Treasury has fallen to 4.80%. The yield curve inversion (2-year greater than 10-year) is still a cause for concern in the market, but does not seem to have the same overall negative sentiment as previous inversions have caused. Crude Oil is continues to creep higher, trading at 71.37 per barrel. Gold is now trading at 631.20 an ounce.

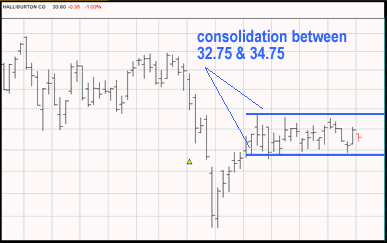
Halliburton Company (HAL) has been trading in a range with support at 32.75 and resistance at 34.75. There are ways to profit off a stock that is in a sideways pattern such as this. Two trades that come to mind are an Iron Condor options spread or a Butterfly options spread. These two methods have the potential to fair well with range bound trading, and will be analyzed during today's trading session.

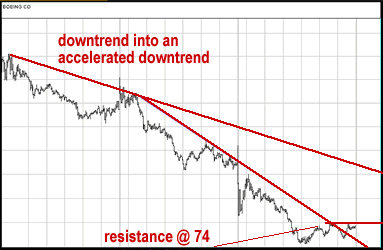
Boeing Company (BA) has not exactly been putting in some impressive price action lately. The 3-day 3-minutes chart below shows a downtrend into an accelerated downtrend. The accelerated downtrend line was broken as the stock consolidated into closing on Friday's low volume session. Resistance at 74 will act as the next level of interest in BA, followed by resistance at the initial downtrend line.

Andy Swan is co-founder and head trader for DaytradeTeam.com. To get all of Andy's day trading, swing trading, and options trading alerts in real time, subscribe to a one-week, all-inclusive trial membership to DaytradeTeam by clicking here.