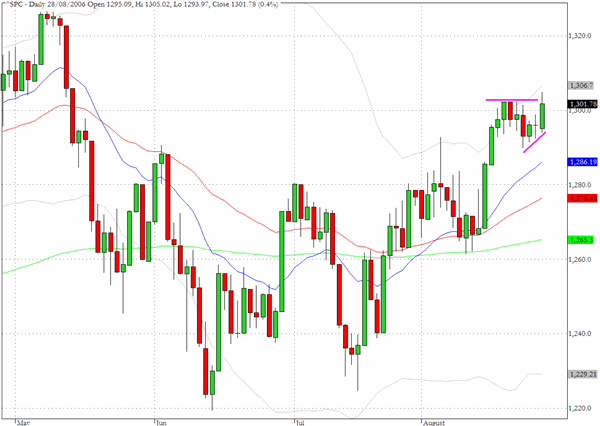
The S&P 500 cash index pushed up to an intraday high just above 1305 in yesterday's trading which was the first time it had been at this level since mid May. The close was just below 1302 and slightly below the close from August 18. The multi-year high achieved in May is just above 1325 which is less than two percent from where we closed yesterday.
We would expect this level to be tested before the end of this week but as the charts below are suggesting the dynamics of the overall market have been transforming subtly over the last few weeks with leadership no longer coming from the Russell 2000 and with a more problematic chart formation on the Nasdaq composite than was evident earlier this year.
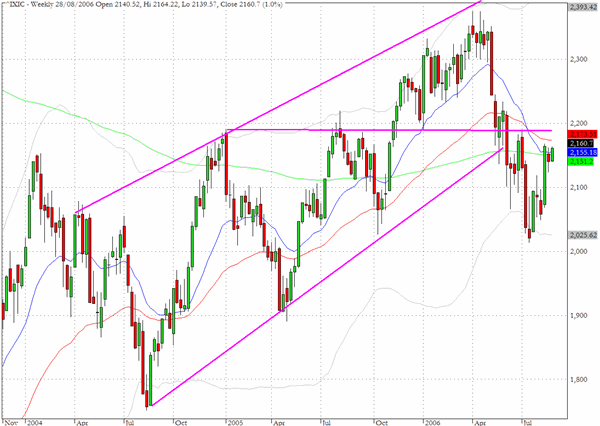
The weekly chart of the Nasdaq Composite (IXIC) highlights the relative weakness shown by this broad index since May. A two year upward channel has been violated during the recent correction and the index is now confronted with the twin hurdles of re-entering this channel in a decisive manner and pushing ahead of the 200-week EMA which is more or less where the index closed yesterday.
If the S&P 500 and DJIA are to mount a sustainable new leg up as we move into the fall we would suggest that the Nasdaq composite has to show convincingly that it can break above 2200 in the near future.
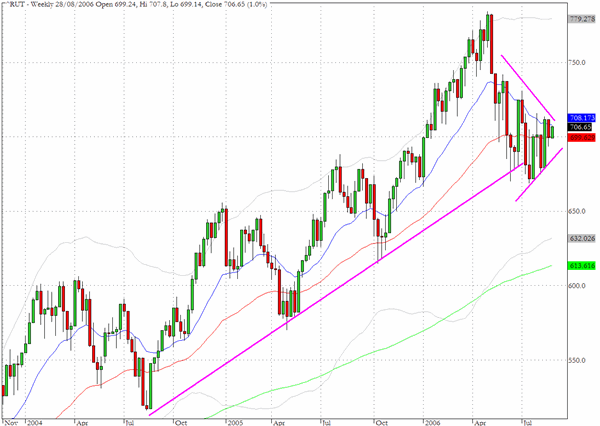
The weekly chart of the Russell 2000 (^RUT) for the same period as the chart above shows an upward channel that is arguably still intact. But we would also argue that the triangular chart formation that has been emerging over the last twelve to fifteen weeks is revealing more of the characteristics of congestion and uncertainty than the previous sharp rebounds when the index touched the bottom of the channel.
TRADE OPPORTUNITIES/SETUPS FOR TUESDAY AUGUST 29, 2006
The patterns identified below should be considered as indicative of eventual price direction in forthcoming trading sessions. None of these setups should be seen as specifically opportune for the current trading session.
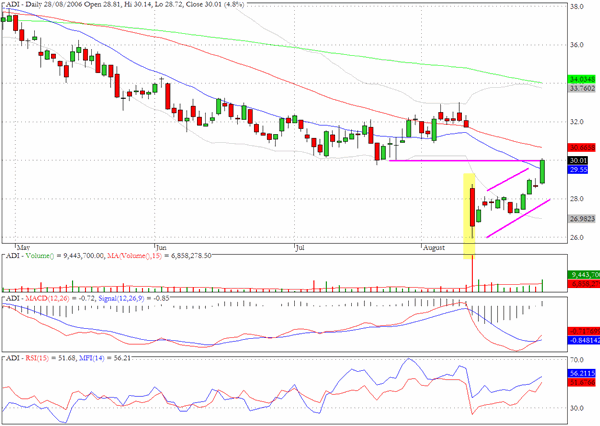
Analog Devices (ADI) rallied strongly yesterday but has reached a chart area where near term resistance is to be expected.
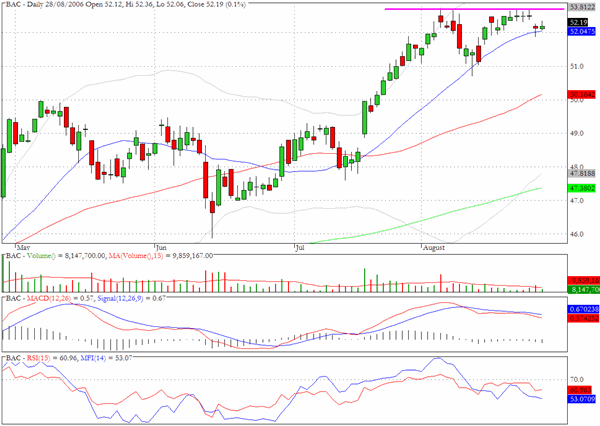
We mentioned Bank of America (BAC) last week as showing signs of fatigue and the chart pattern still looks as though a retreat towards $50 is likely.
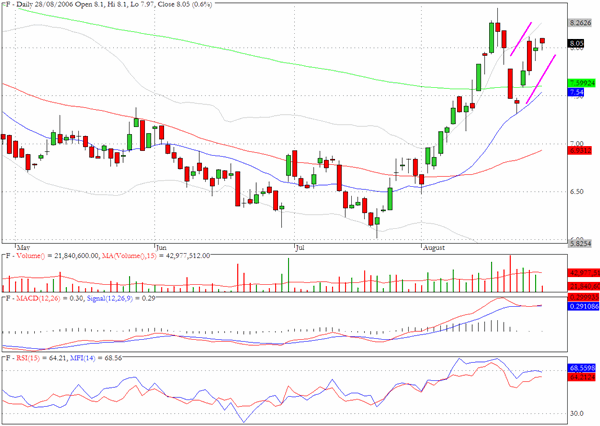
It would be useful to monitor Ford Motor (F) as it tries to reach back towards $8.40 where sellers took control a couple of weeks ago.
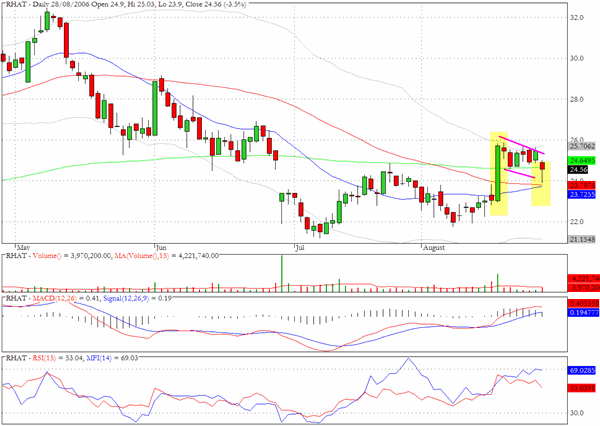
Red Hat (RHAT) registered a long lower tail as it retreated by more than five percent intraday. Overall the pattern suggests that there were buyers willing to support the stock at $24 and perhaps push it further upwards out of a bullish flag formation.
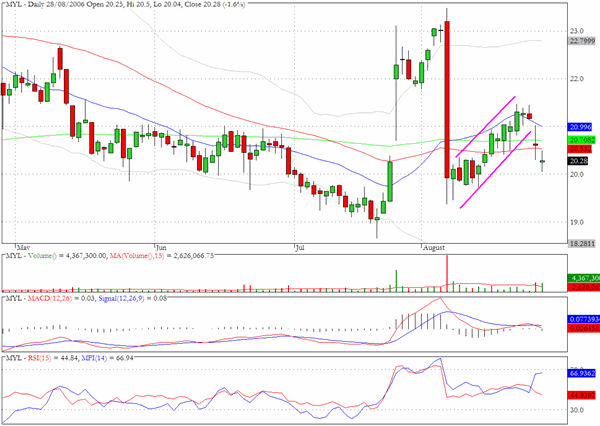
We cited the possibility last week of Mylan Labs (MYL) dropping out of the ascending channel that followed from the steep drop at the beginning of the month. The action over the last two sessions has brought the stock down by more than four percent but we may see a re-test of the $19 level eventually.
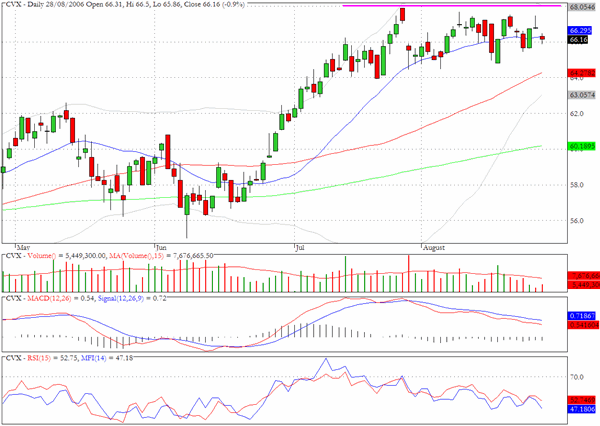
Chevron Texaco (CVX) appears to be losing momentum after encountering resistance near $68.
Clive Corcoran is the publisher of TradeWithForm.com, which provides daily analysis and commentary on the US stock market. He specializes in market neutral investing and and is currently working on a book about the benefits of trading with long/short strategies, which is scheduled for publication later this year.
Disclaimer
The purpose of this article is to offer you the chance to review the trading methodology, risk reduction strategies and portfolio construction techniques described at tradewithform.com. There is no guarantee that the trading strategies advocated will be profitable. Moreover, there is a risk that following these strategies will lead to loss of capital. Past results are no guarante of future results. Trading stocks and CFD's can yield large rewards, but also has large potential risks. Trading with leverage can be especially risky. You should be fully aware of the risks of trading in the capital markets. You are strongly advised not to trade with capital.