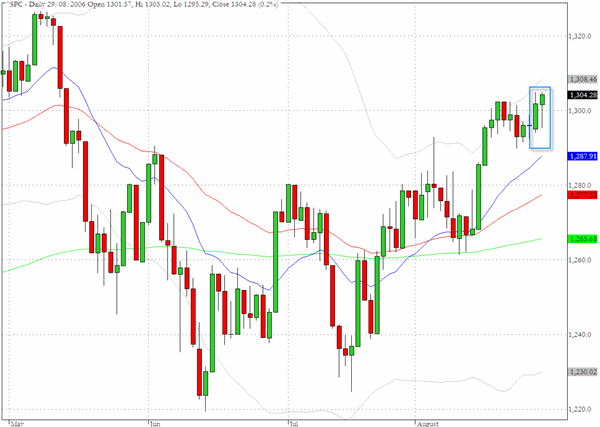
Despite the small gain of 0.2% the S&P 500 cash index registered an inside day yesterday as the intraday high failed to match the level attained in Monday's trading. The weak consumer confidence data and the release of the FOMC minutes provided an opportunity for market analysts and commentators to discuss the possibility that the Fed's next move may be a downward one and this could lift sentiment sufficiently to see further gains in coming sessions
There are less sanguine consequences of the weakening consumer sector that may bring a different set of concerns as further economic data is released in September.
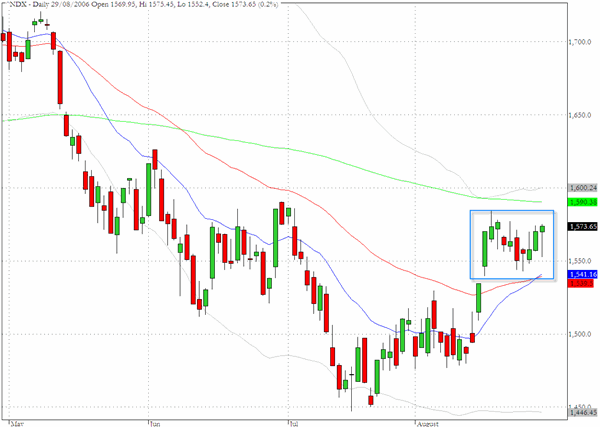
The Nasdaq 100 cash index (^NDX), in similar fashion to the S&P 500, recorded a small gain with a long lower tail in yesterday's trading. As the "box" formation suggests the index has essentially traded entirely within the range of the long green candlestick that was registered on August 16th.
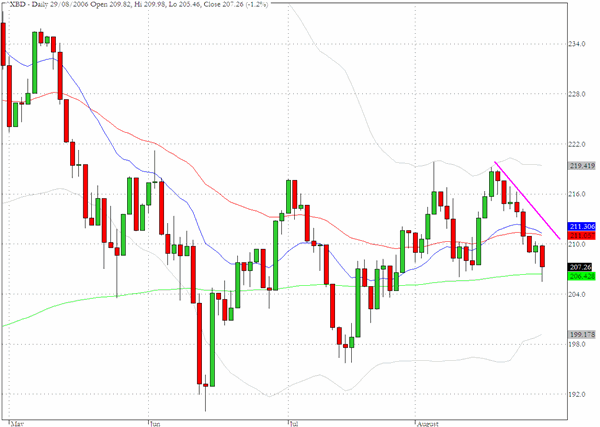
The broker/dealer sector (^XBD) has seen several days of weaker closes despite the resilience of the broader market and is now poised at the 200-day EMA.
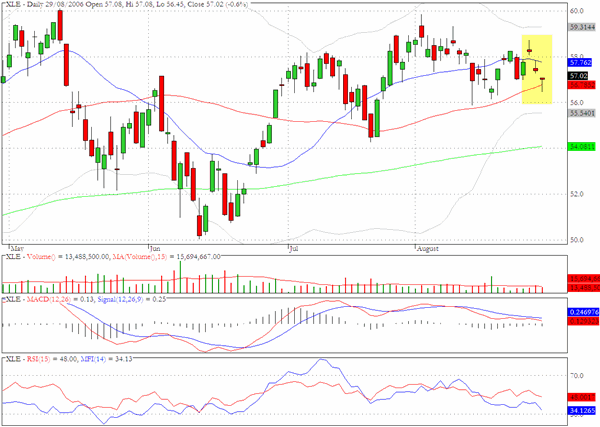
XLE, the exchange traded fund for the energy sector is responding to the newsflow with overnight gaps but still trading within fairly narrow ranges intraday.
TRADE OPPORTUNITIES/SETUPS FOR WEDNESDAY AUGUST 30, 2006
The patterns identified below should be considered as indicative of eventual price direction in forthcoming trading sessions. None of these setups should be seen as specifically opportune for the current trading session.
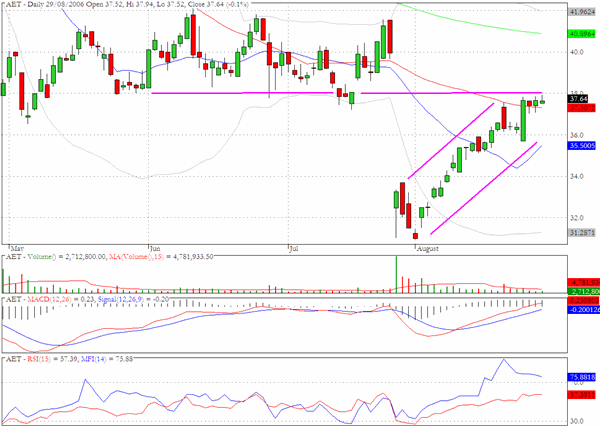
Aetna (AET) has recovered back to a chart level which may provide some near term resistance.
Bear Stearns (BSC) dropped below its 50- and 200-day EMA on above average volume.

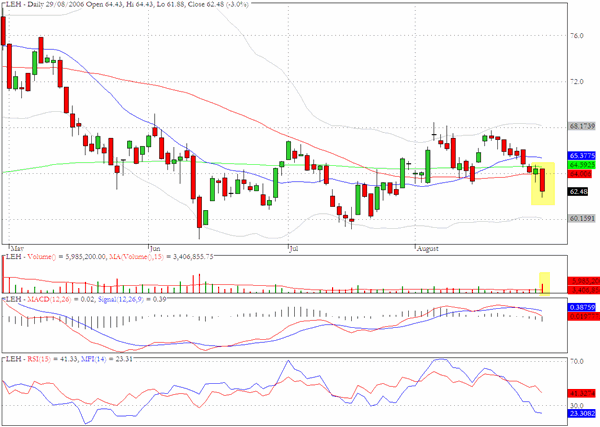
Lehman Brothers (LEH) also closed below its 50- and 200-day EMA on almost twice its average daily volume
Clive Corcoran is the publisher of TradeWithForm.com, which provides daily analysis and commentary on the US stock market. He specializes in market neutral investing and and is currently working on a book about the benefits of trading with long/short strategies, which is scheduled for publication later this year.
Disclaimer
The purpose of this article is to offer you the chance to review the trading methodology, risk reduction strategies and portfolio construction techniques described at tradewithform.com. There is no guarantee that the trading strategies advocated will be profitable. Moreover, there is a risk that following these strategies will lead to loss of capital. Past results are no guarante of future results. Trading stocks and CFD's can yield large rewards, but also has large potential risks. Trading with leverage can be especially risky. You should be fully aware of the risks of trading in the capital markets. You are strongly advised not to trade with capital.