NASDAQ Commentary
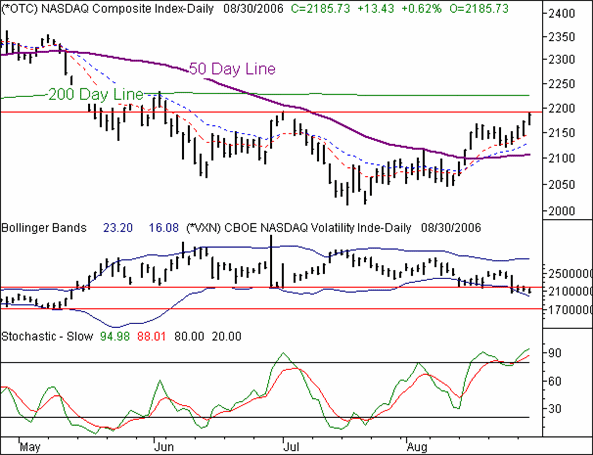
Thanks to Wednesday's gain of 13.43 points, the NASDAQ is up by 45.44 points for the week. The close at 2185.73 is 2.12% above last Friday's close, and 0.62% where we were at the end of trading on Tuesday. At this point, and despite the odds against it, we have to say we're impressed by the bullish action. Our original expectation was more on the bearish side of things, but the buyers have been persistent. So, we have to make at least a slight adjustment to our stance.
First and foremost, we're still not absolutely convinced this rally will go any further, for the same reason as before...the VXN still shows us an almost strange degree of complacency - one inconsistent with the beginning of most rallies. However, the charts don't lie. We're up for this week, we were only down slightly last week, and we were up big the week before that. The trend is your friend...and our friend - like it or not - has been bullish.
On the flipside, the market hasn't stayed this overbought since March, and remains totally vulnerable to even a small wave of profit-taking. Plus, and this is the biggie, take a look at today's high of 2188.55. That's suspiciously close to the July 3rd peak of 2190, which also set up a major pullback over the rest of that month. The current chart and the chart from then don't necessarily look too much alike, so we don't want to draw too many conclusions, but it is more than a little curious.
And what about the VXN? Same as before - too low for our comfort. But, while the VXN has spent most of the last three weeks being 'too low', its lower Bollinger Band has been drifting lower. In other words, the support/floor isn't just a hair under it...we could indeed see the VXN fall lower, while stocks move higher. Again, it doesn't seem likely, but the bulls have remained defiant of late.
So, here's the deal...we still foresee a pullback in the near future. The question is just to what degree. A couple of weeks ago we figured it could be a substantial one, pulling the composite all the way back to the 2000 area. Now, we're not so sure. A lot of resistance barriers have been broken, and could potentially serve as support now that we're so far past them. The 10, 20, and 50 day moving averages are just one example. A slide back to any of them would sufficiently ease the tension, but not even come close to breaking the uptrend. Truthfully, if you're bullish, that would be the 'ideal situation'. It would provide you with a lower-risk entry point, and it would verify that the current uptrend is new money, and not just a lot of short covering
We'd really like to see how the next two days pan out before making a firm call. A heavy dose of bullish movement would actually put the composite into dangerously overbought territory, which could jump start a big selloff that might not get stopped for a while. Some easing back to the 20 day line or so, followed by some buying, would be much easier to stomach. But, as long as the 50 day line at 2106 holds, we're not nearly as apt to go bearish as we were.
NASDAQ Chart

S&P 500 Commentary
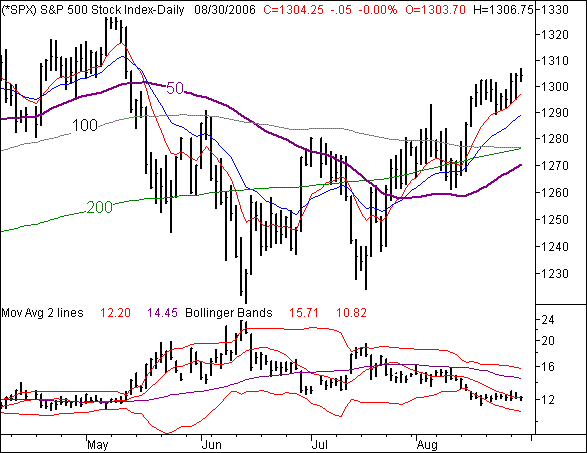
The S&P 500 ended flat for Wednesday, but is still up by 9.15 points for the week. That's 0.71% above Friday's close, leaving the large-cap index at 1304.25. Lagging other indices (badly), we have to wonder why the SPX can't keep pace with the much more fickle NASDAQ. And more importantly, was Tuesday's doji bar a red flag of some sort? Let's tell the other side of the bull-vs-bear using the S&P 500 as a case study.
While the commentary on the NASDAQ was slightly bullish (with a caveat), we're a little more compelled to punch holes in the SPX's bullish trend. There are plenty of reasons.
If you're tired of hearing us preach about the VIX, we understand - we're tired of it too. Yet, it doesn't change the fact that it's still a huge liability. It hasn't budged for more than two weeks now, even though the S&P 500 has made big gains since then....or has it? It may be hard to believe, but the S&P 500 is only up by 7 points (0.5%) over the last 10 trading sessions. A lot of pundits have been touting the strength of large-caps recently as their bullish argument, but that really hasn't been the case.
This wasn't something we had considered initially, until we got highly curious about the VIX's stagnation. Now that we've done the math, it makes a little more sense. And, now that we've done the math, we're not nearly as impressed by the market's strength...or lack thereof.
Second - and more straight-forward - the SPX is overbought...plain and simple.
The bullish counter-argument could be made by the clear support at the 10 day moving average line (red), which was a foundation like a rock over the five sessions before today's. Also, all of the key moving averages are pointed higher, save the quirky 100 day line, which is rarely on our radar anyway.
The bottom line is, like the NASDAQ, we're looking for a pullback of some sort now...just not a very big one. The index is still a little over-extended, but with all the bigger-picture bullish momentum in place, we'd say 1275 is about as low as the bulls are willing to let the market fall - where the 100 and 200 day line are currently parked. If we slip under those lines, then we'll revisit our bearish view. Otherwise, any dip looks like it would actually be a good buying opportunity.
All this being said, the bearish trump card is still the VIX.
S&P 500 Chart

Price Headley is the founder and chief analyst of BigTrends.com.