The market is dull and slowly rising once again. Month-end window dressing has been a boon to the bulls, as day after day this week we've seen a substantial amount of buy programs -- evident from the high TICK readings that have occurred. Usually, this type of buying spills over in the first three days of the ensuing month, but sometimes that's not true of September, when the number of players increases after the Labor Day weekend. With September being the weakest month of the year, one wonders if the bulls can hold this rally together when the window-dressing ends.
It is going to be interesting to see how next week plays out. It's unlikely to be more of the same. Rather, we would expect much more volatility. One scenario is that the bulls will win the day, and the positive technical indicators that we currently see will aid the market in moving higher. But the other, bearish, scenario is that selling pushes the market lower to begin with, followed by sell signals from the technical indicators, and then a general breakdown of prices. Either seems plausible.

Take market breadth, for example. It has been quite positive the last few days -- especially on the NYSE. Overbought breadth is a positive sign while it lasts, but if the advance-decline numbers turn negative, breadth will generate a sell signal fairly quickly.

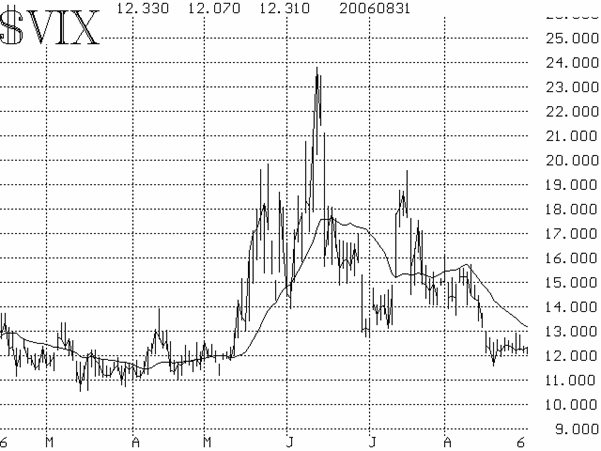
$VIX is in a similar state. It is very low (i.e., overbought). But as long as it remains low, the market can rally. Today, $VIX is hovering below 12.20. However, if selling were to begin, $VIX could easily begin to move higher, and after a couple of days of that $VIX would be trending higher -- a sell signal.
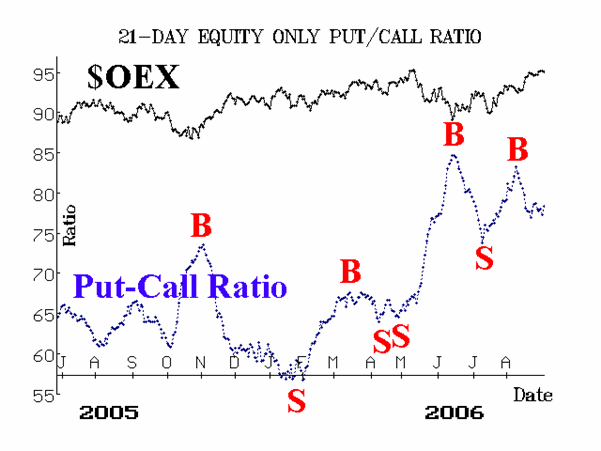
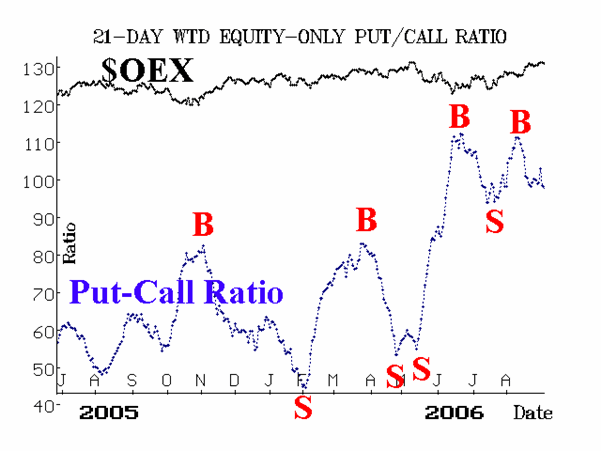
On the other hand, the equity-only put-call ratios are not currently overbought. In fact, they are quite the opposite, having remained high in their charts for several weeks now. We have been waiting for them to at least drop below the early August lows to re-confirm their bullish downtrends. Yesterday's action nearly accomplished that, as the put-call ratios dropped (see Figures 2 & 3). This indicator is far less likely to give a sell signal right away, even if the market initially declines after Labor Day, but it is still possible that it could.

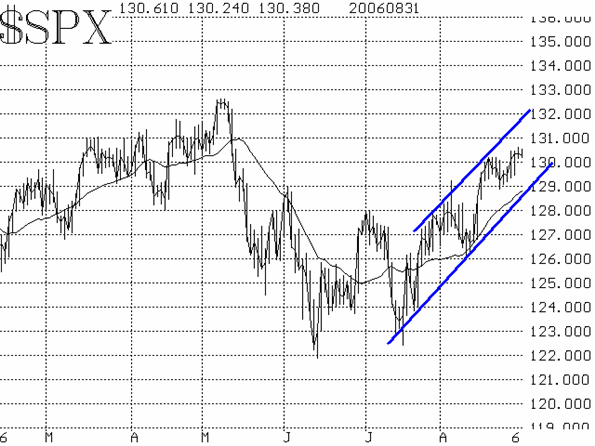
Finally, there is the matter of the $SPX chart itself. $SPX is in an uptrend, and there is also underlying support at 1290. If that 1290 area gives, way, then the first target would be support at 1280. If that doesn't hold, things could get ugly again.
So, for now, things are positive. But it wouldn't take much for deterioration to set in -- especially if $SPX falls below support at 1290. So, take some partial profits and tighten your stops, but maintain long positions for now.

Lawrence G. McMillan is the author of two best selling books on options, including Options as a Strategic Investment, recognized as essential resources for any serious option trader's library.