I had occasion to be in my car this morning, listening to CNBC, when the host of the show was arguing with a modestly bearish guest. Yes, there are a lot of reasons for concern noted by bears, but the market is clearly disagreeing with their pessimistic views. Stock indices are hitting cycle highs and seem poised to go higher. He and many other optimists seem to be of the opinion that since the market is going up, it is telling us that the economy is ready to find a Goldilocks "Ahhh, this porridge is just right!" soft spot on which to land.
However, as I remember it, the end of the Goldilocks fairy tale is not so sanguine. The final lines are "Just then, Goldilocks woke up and saw the three bears. She screamed, 'Help!' And she jumped up and ran out of the room. Goldilocks ran down the stairs, opened the door, and ran away into the forest. And she never returned to the home of the three bears."
But Bob makes a good point, which should give us pause. How does one argue with Mr. Market? Shouldn't the collective wisdom of hundreds of millions of investors give us reason for concern when they clearly disagree with our own modest insights? Fighting the trend is never a good way to stay alive in today's markets.
To answer the question we are going to review a little history. Specifically, we are going to go back 6 years, to September 1 of 2000. Coincidentally (or not?), September 1, 2000 was also a Friday preceding Labor Day. We will look at the stock market, the yield curve, and bubbles on that day and compare it with today. I think you will find it informative.
DéjàVu all Over Again
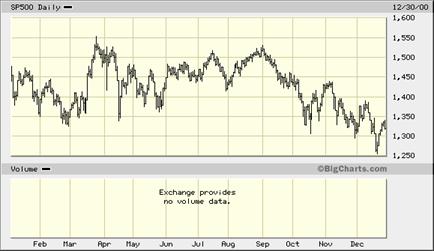
Let's look at two charts. The first is the S&P 500 from January 1 to December 31, 2000. Notice that the market made its first highs in the spring and then made a real run at those highs in late August. The cycle high was September 1, 2000, where the market closed a tad over 1520. It has yet to recover, still down almost 15% over the last six years at 1311.
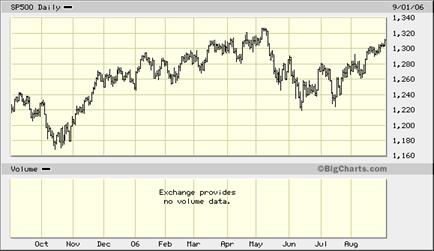
The next chart is from January of this year 'til today (September 1, 2006). Again, we see the market making new highs in the spring, falling back, and then making a legitimate summer rally run at new highs. But you can find charts which show some indexes at all-time highs. This has been a good time for the bulls. Now, let's look at the charts, and then I will comment on them.
This Time It's Different
Let's put some context to those charts. In 2000, we had an inverted yield curve (where short rates are higher than long rates). On September 1 the 3-month bill was at 6.27%, 0.59% higher than the 10-year yield, which was at 5.68%.
The inversion of the yield curve would top out four months later at a negative 0.95%. At such levels, the yield curve was telling us the probability of a recession was better than 50%.
Today, the 3-month bill is at 5.01% and the 10-year is 4.73%, for a "mere" inversion of 0.28%; but that inversion is rising, as the 10-year note is dropping faster than the 3-month. My friend Martin Barnes at Bank Credit Analyst, as good a predictor of interest rates moves as there is, writes in this month's letter that he thinks 10-year rates will go down to 4.5%. Assuming the 3-month rate does not move too much lower until the Fed begins to lower rates sometime next year, that would bring us to a 50 basis point inversion for some period of time.
Let's look at the yield curve and rates today (chart from Bloomberg.com).
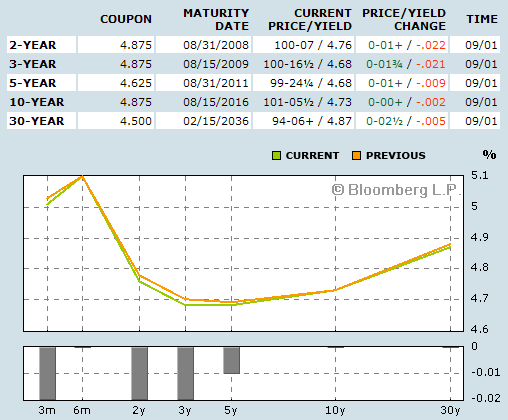
(One point. Back in 2000, the curve looked roughly the same on the short end, as the 6-month yield was a few basis points higher than the 3-month yield, and thus the "spike" at the 6-month level.)
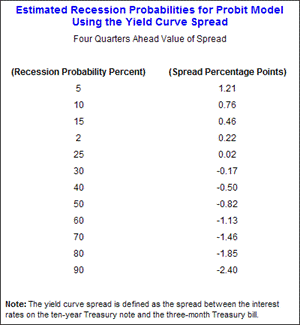
Estrella and Mishkin, the authors of a 1996 Fed research paper, developed a probability table about how likely a recession would be 4 quarters later, given a particular level of the yield curve spread. Let's look at that table from that paper. They used a 90-day average of the yield curve. Speculating about the potential for the rest of the year, if the 10-year note moves to 4.5%, we could see the 90-day average go to the -0.40% range, or a 35% or so probability of recession within the next 4 quarters.
The authors of that 1996 Fed study said they thought that in a few decades we would see the probability of a recession increase with less of an inversion, as the first few incidences of yield-curve inversions and recessions were in periods of far greater economic volatility (at least in terms of GDP). That means the probabilities of a recession might indeed be higher than the table suggests.
As an aside, if we enter into a recession next year, then that observation will prove to be quite prescient.
In September of 2000, economists and bullish money managers were telling us that "This time it is different." They specifically pointed to the fact that the market was close to making new highs. We were heading for a soft landing. Not one of the Blue Chip economists at the time was predicting a recession. As an aside, we now know the economy was slowing dramatically and would be in recession by March of 2001, two quarters before the normal four quarters the Fed study suggested.
The Fed would be cutting rates less than five months later, but as we know, a recession came anyway. I distinctly remember Jim Cramer writing (pounding the table in his own unique style) that when the Fed started cutting in January you HAD to buy the market. He cited data that the market was up 12 months after the Fed started a rate-cutting cycle. He was a tad early about getting back into the market.
Pick a Bubble, Any Bubble
I happened to be at the Intercontinental Hotel last night with some friends. There was a magician's convention, and they were out in force at the bar. It seems they all had decks of cards and were showing each other the latest card tick. "Pick a card, any card!"
In 2000, we were still in the midst of the bursting of the stock market bubble of the late '90s. Today, we are seeing a housing bubble implode in slow motion. (See more below.) It looks and sounds eerily like September 1, 2000. It is the point in the western where someone says, "It's quiet out there, too quiet!"
To be a bull today, you have to think that this time it is different. You must believe that the inverted yield curve, which has yet to be wrong about a future recession, is giving us a false positive. Because if we do get a recession or even a "mere" serious slowdown, then the stock market is going to drop. It always has. Always.
To be a buyer today, you have to think that the housing market is not going to be all that big a problem, that consumers will be able to once again maintain their increase in spending.
I suggest you read the end of the fairy tale. Goldilocks, rested and comfortable in the moment, ended up fleeing for her life in the end.
So no, I don't think Mr. Market, or at least the price action, can tell us when the economy is getting ready to turn over. Prior to every market drop and recession, the market has made new cycle highs. As more than a few commentators have noted, the market works diligently at creating the most pain for the most number of people. I sadly think there is some pain in the future as this economy slows down.
Is a recession a certainty? Is it locked in? No. It's not. I could be wrong and this time it could be different. Someday it will be, I guess. But the probability of a recession is high and getting higher. I think a serious slowdown is a very high probability. And that is not a good environment for stocks in general, although there will certainly be exceptions.
And that is what I think the bond market is telling us. Why would rates be falling if the economy is going to go up?
By the way, just to bring in a brighter view, there are very credible groups, among them Martin Barnes at Bank Credit Analyst and my friends at GaveKal, who think the economy will not fall into outright recession, and who are still recommending a modestly overweight position in stocks. They think falling treasury yields will keep stocks modestly attractive and that over the long term, returns on the stock market will be modest, but better than bonds.
A Few More Thoughts on the Housing Market
Let me share with you a quick note I got from Charles Gave in response to last week's Outside the Box. I used a blog from Professor Nouriel Roubini on the housing market, where he said we were in the biggest housing slump in 40 years. I will let Charles make his own eloquent point:
"Dear John,
"The biggest housing slump in the last 40 years is the title of your last piece. Really? Makes for a good title, but far from being true. Look at the graph below: the slumps of the 60's and 70's and the one at the end of the 80's were far bigger, and House sales were a far bigger component of the GDP at the time.
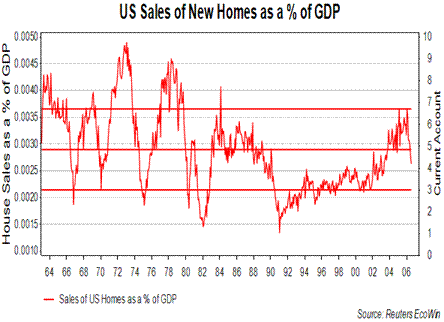
"On a rate of change basis same message: On a 12 months rate of change basis, the declines in house sales, on a variation basis, as a % of GDP are still far from the depths reached in 67, 71, 74, 80, 82, 95...
"On a 36 months basis, we are still way above zero, compared -25% in 1967, 1971, -50% in 1980-82, -30% in 1991...and the cycles seem to be getting smaller, not bigger...
"Housing does not look good, but this is certainly not unprecedented. May I also suggest that at the previous low points we had real rates at punitive levels, which is not the case today, I believe. "I am not a great bull on real estate right now, but when I look at the media, I almost feel like buying. The only thing missing is the front cover of the Economist or of Business Week. Hope to see you soon. - Charles Gave"
But Charles is right. It is not as bad as it has been in the past, and not by a long shot. Not that it can't get worse. Look at this chart from good friend Gary Shilling.
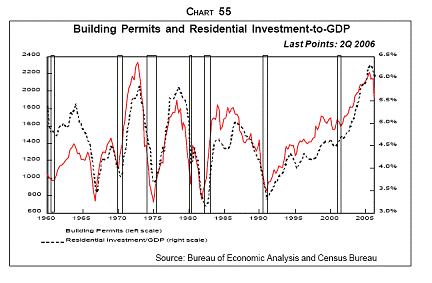
As Gary noted, drops of 50% in residential construction are common, with rebounds coming rather quickly. Why does this happen?
Once homebuilders start a house, they are reluctant to not finish it. So what happens is that they finish what is on the books, leading to an oversupply of new homes. As anyone does with excess inventory, they stop making more until they get their inventories in line with sales. Thus construction drops precipitously for a time.
That cycle could be made worse this time, as speculation in many markets has seen upwards of 25% or more of homes bought by "investors" who intend to flip them. Since they cannot rent them for the cost of interest and taxes, they are losing money each month. These homes will start to go on the market just as the supply of new homes is at a high.
I read and hear the quote that the national housing market has never had a calendar year (Jan. to Jan.) where the average price has gone down. But this can be a very misleading statistic. There have been lots of local markets where home prices dropped 25% or more in a year. Think the oil bust in the '80s which hammered Texas and Oklahoma, or California in the '90s, or Boston a little later.
We had a rolling housing recession in this country, hitting one region at a time; but overall the bulls are correct, the average price of a home in the US did not go down.
But now we are watching a national bubble burst, in multiple regions. Home prices are down in many areas year over year. The median price of homes year over year fell into negative territory at the end of July. We could easily see that extend to the 2007 calendar year.
As we see both new and existing homes-for-sale inventories rise to high levels and sales begin to decline by more than 10%, pressures on home prices are going to increase. There are scores of areas where more than 25% of homes for sale have seen their prices lowered in recent months.
Home affordability is at a 16-year low. Look at this chart, again from Gary Shilling. Is it any wonder that home sales are slowing? Plus, the majority of people who have a propensity to buy a home already have.
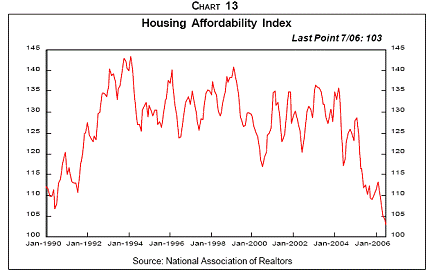
Given that real estate, in one form or another, accounted for about one-third of the jobs created in this last recovery, this does not bode well. Nor does the fact that home equity loans accounted for the bulk of the increase in consumer spending in recent years.
How ugly will it get? Not as ugly as in past cycles, as I think the Fed will once again step in and cuts rates aggressively. But it could be uncomfortable if you have the need to sell. However, if you are in the market to buy, it could be a great opportunity. Stay tuned.
John Mauldin is president of Millennium Wave Advisors, LLC, a registered investment advisor. Contact John at John@FrontlineThoughts.com.
Disclaimer
John Mauldin is president of Millennium Wave Advisors, LLC, a registered investment advisor. All material presented herein is believed to be reliable but we cannot attest to its accuracy. Investment recommendations may change and readers are urged to check with their investment counselors before making any investment decisions.