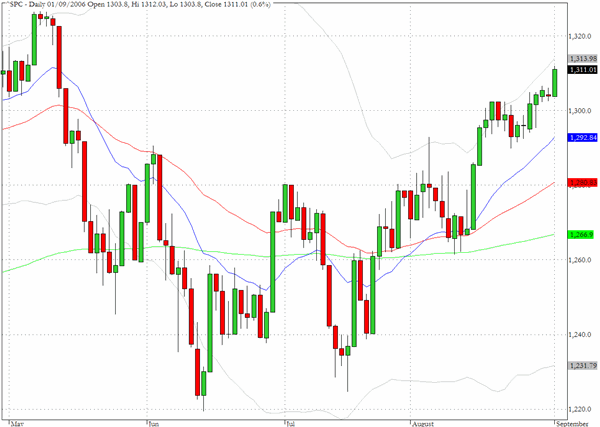
Friday's employment data was essentially in line with expectations and provided the backdrop for a continuation of last week's positive price action. Volume picked up a little on Friday but most of last week's subdued trading for the S&P 500 could be seen as a gentle drifting back towards the early May high. We should get a better feel for how the 1325 threshold sits with fund managers in the days ahead.
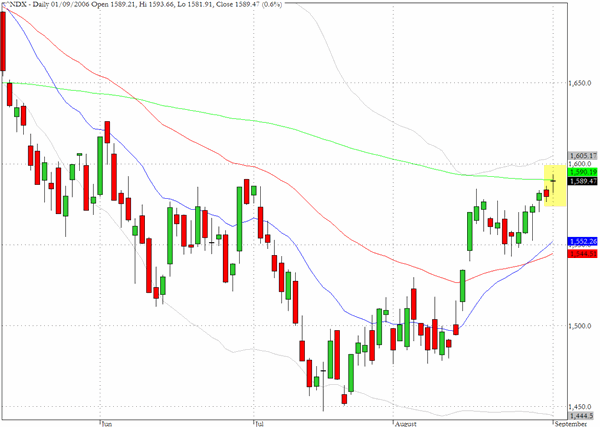
The cash index for the Nasdaq 100 (^NDX) put on a 0.6% gain last Friday, but the enthusiasm of the pre-session reaction to the employment data, which produced an upward gap on the open, was not really matched with any further buying pressure during the rest of the session. The index closed more or less where it began and registered a Doji candlestick formation that came to rest almost exactly at the level of the 200-day EMA.
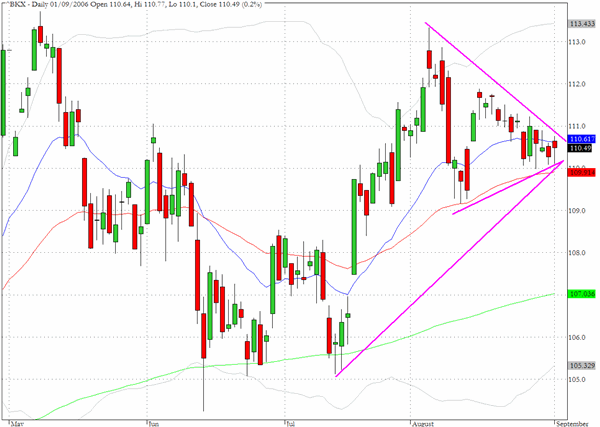
There was a fairly subdued reaction to the data on Friday from the Treasury market with the yield on the ten year note closing at 4.73% which was exactly the same close as the previous session. The banking sector (^BKX) also seemed not to find any resolution for its directional uncertainty from the economic data. We suspect that asset managers are keeping one eye on the deteriorating housing market and this may be cooling some of their positive reaction to the decline in long term bond yields.
TRADE OPPORTUNITIES/SETUPS FOR TUESDAY SEPTEMBER 5, 2006
The patterns identified below should be considered as indicative of eventual price direction in forthcoming trading sessions. None of these setups should be seen as specifically opportune for the current trading session.
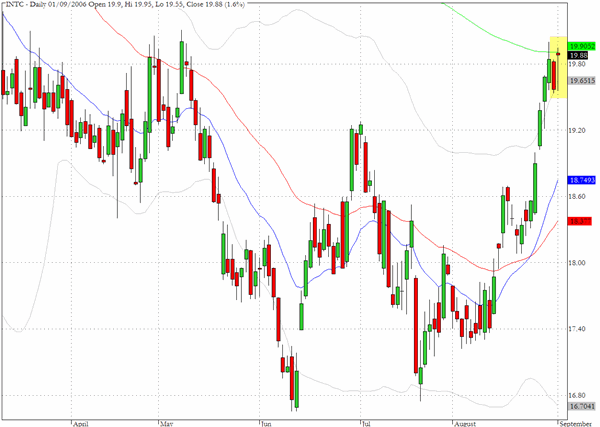
As we anticipated INTC seems to have encountered resistance at the $20 level and registered a hanging man candlestick formation.
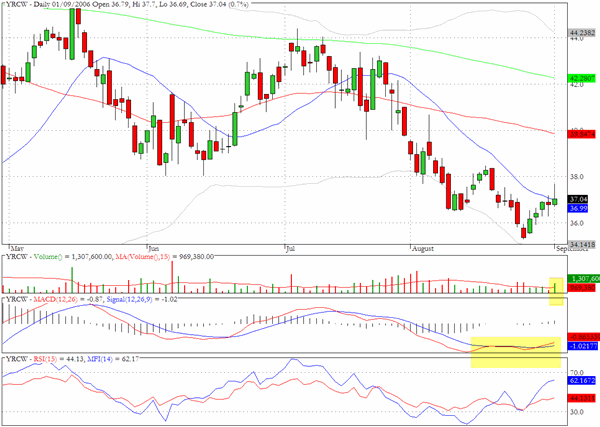
YRCW has some positive divergences and Friday's volume was above average as the stock tried to push higher. We would expect to see an attempt at the 50-day EMA eventually.
Many of the banking stocks appear not to have been energized by the economic data released on Friday and Bank of America continues to drift with waning momentum.

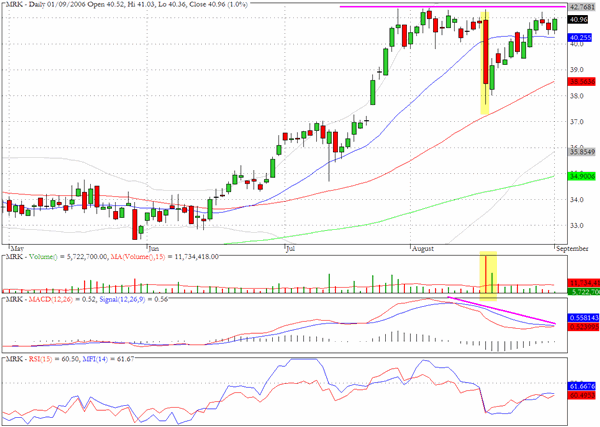
Merck (MRK) has rallied back towards $41, a level from where it suffered a heavy volume sell-off in mid August. The momentum and money flow characteristics are suggesting that the recovery effort may have run its course in the near term.
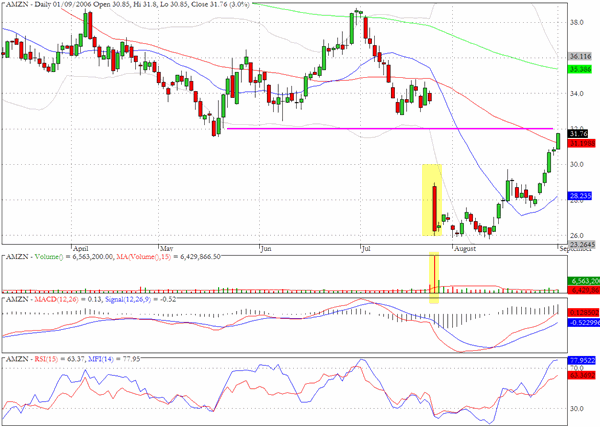
Amazon (AMZN) may also have reached a short term zenith in its recovery channel.
Clive Corcoran is the publisher of TradeWithForm.com, which provides daily analysis and commentary on the US stock market. He specializes in market neutral investing and and is currently working on a book about the benefits of trading with long/short strategies, which is scheduled for publication later this year.
Disclaimer
The purpose of this article is to offer you the chance to review the trading methodology, risk reduction strategies and portfolio construction techniques described at tradewithform.com. There is no guarantee that the trading strategies advocated will be profitable. Moreover, there is a risk that following these strategies will lead to loss of capital. Past results are no guarante of future results. Trading stocks and CFD's can yield large rewards, but also has large potential risks. Trading with leverage can be especially risky. You should be fully aware of the risks of trading in the capital markets. You are strongly advised not to trade with capital.