Well, you don't have to be a brain surgeon to know Wednesday was radically different than the general bullishness we had grown accustomed to over the last few weeks. The NASDAQ fell by 1.7%, and the S&P 500 fell almost 1.0%. It wasn't a disaster for the bulls, although it wasn't comfortable either.
The question is, was there anything significantly different about Wednesday that should serve as a red flag? Or, was Wednesday just a run-of-the-mill correction, and be footnoted as a typical blip within a long-term uptrend? Well, our qualified answer is that Wednesday was the former. It included some unusual data that tells us there may be more to it than meets the eye. And, although the data we need is still not all in, the charts so far have a bearish implication.
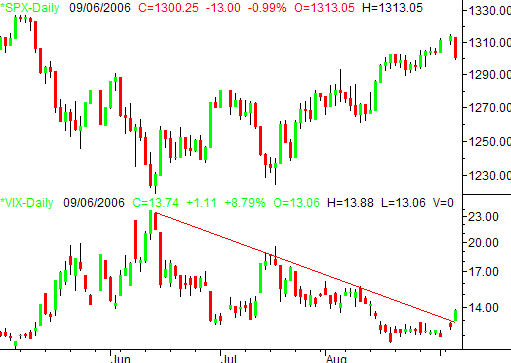
First, and perhaps foremost, the CBOE Volatility Index (or VIX) has finally broken out of a three-week rut, moving from 11.96 to 13.74 over the past two days. That move also puts the VIX above a resistance line that extends all the way back to early June. So, yes, something is distinctly different now. This may be the biggest bearish factor stocks will contend with in early September, and as the chart shows, these VIX uptrends have not been kind to the market. However, we've been overdue for a while.
S&P 500, with CBOE Volatility Index

In the wake of such a strong move for the VIX, and a strong dip for the market, we wouldn't be stunned to see things ease in a slightly bullish way tomorrow, and even Friday. But, don't be fooled - a lot of damage has already been done. Unless the indices can end the week with a gain, and unless the VIX can get back to last week's levels, the sellers may be motivated to continue selling into next week...and maybe even beyond.
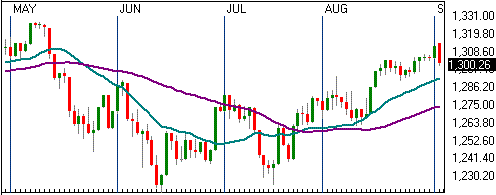
Aside from the VIX, we also want to point out a key reversal pattern the S&P 500 logged yesterday. The two-bar pattern is called a 'bearish engulfing' day, formed when the second makes a higher high, and also a lower low on the same day. To qualify as a bearish-engulfing pattern, the first day's close has to be positive, and above the open; the second day's open has to be above the previous day's high, and the close has to under the prior day's low. The second day's open-to-close range essentially 'engulfs' the previous day's high-to-low range. The premise is one of transition. The bulls had their last hurrah on the first day, then the next day, the bears decisively took over.
S&P 500, highlighting bearish engulfing pattern

As you can see, the SPX made a bearish engulfing pattern on Tuesday and Wednesday. However, please also note that some data services may not show the higher opening (our does). Based on the 9:30 am EST open, we didn't actually open higher than Tuesday's close. Based on the pre-market data from Wednesday, we actually did open above Tuesday's high. It's a technicality, so don't dwell on it if your data doesn't show quite the same thing...we've just found that our pre-market readings allow for a a little better indication of market dynamics.
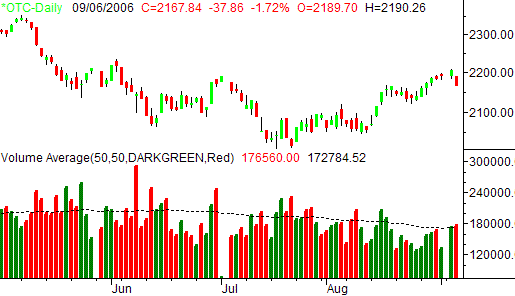
Our final bearish clue lies in volume. To be specific, the volume behind Wednesday's selling was stronger than most of the bullish volume we saw during the market's rally in August. While it was tough for the rally to entice buyers, it wasn't too hard for the dip to encourage sellers. The underlying implication is that - in the back of their heads - traders are nervous about holding long positions right now...and will sell at the drop of the hat (or at least at the drop of a market).
NASDAQ Composite, with volume

Truthfully, the volume data so far is too incomplete to come to any firm conclusion. However, we will say that the current pattern looks like it would at the beginning of a weak period.
All that being said, we're not counting the market out just yet. We're just pointing out the hints. We anticipate needing the data from the last two days of this week to actually make any kind of a call, since one day does not a trend make. Be sure to watch closely how we close out the week, and especially watch the VIX - it's our biggest vulnerability right now.
Price Headley is the founder and chief analyst of BigTrends.com.