NASDAQ Commentary
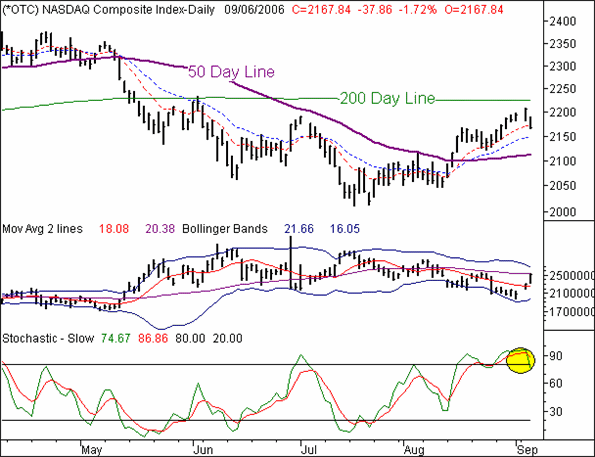
On Friday - what appeared to many as 'from out of nowhere' - the NASDAQ changed its complexion. The Composite fell 1.72% to end the day at 2167.84, and 25.32 points under where it closed last Friday. It was the biggest single-day loss we've seen since July, and although it wasn't catastrophic, it's still nothing that should be blown off.
Wednesday's close was the first close under the 10 day line since mid-August, our first red flag. It was also the first time in a long time the bulls were faced with a critical choice - stay in, or bail out. The fact that they chose the latter (volume was strong) suggests that all is not as bullish as most had originally thought. Of course, we'd be wrong to ignore the obvious warning we've been holding out for since mid-August - the CBOE NASDAQ Volatility Index (or VXN). It had been hovering at bizarrely low levels for about three weeks (save one quick pop up in late August). However, knowing that all things eventually return to their mean/median/average, we also knew that the rally was being made on borrowed time.
Well, here's the result - an over-extended market that finally paid the price. The thing is, only the surface of the bearish potential has been scratched. Stochastically, we're still overbought. In fact, we don't even have a complete stochastic sell signal yet (As a reminder, the official stochastic 'sell' is the point when both of the stochastic lines fall under the 80 threshold). Plus, the VXN is closer to the lower end of its range than the higher end. It closed at 20.19 on Wednesday, but had been as high as 25 in recent weeks.
With all that in mind, don't throw out any possibility just yet - the bulls have been strangely persistent of late, and they may be willing to flood back in today. Needless to say, that makes Thursday an immensely important day to watch Friday too. If the VIX closes higher, and/or the NASDAQ closes lower, then the odds favor a decent-sized pullback. The first checkpoint for such a dip would be the 50 day line, currently at 2111. We may go even lower than that, but we'll want to re-assess once we get to that mark.
By the way, from here, only a couple of closes above the 200 day line would be considered bullish. It's currently at 2225.
NASDAQ Chart

S&P 500 Commentary
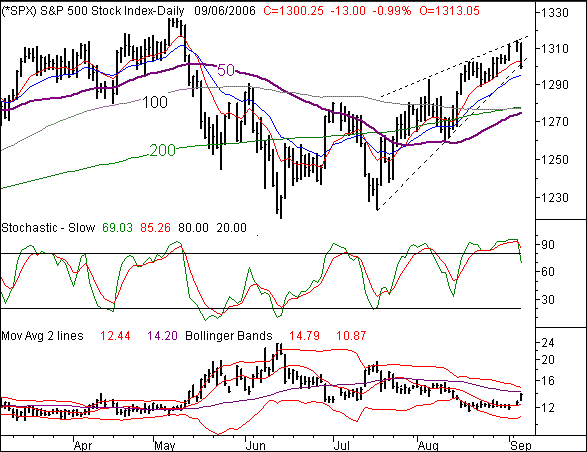
The S&P 500's 1.0% loss yesterday may seem relatively tame, but it was actually the biggest setback the large-cap index has suffered since mid-July. Losing 13.0 points on Wednesday, the SPX is now down by 10.75 points for the week, or -0.82%. It's mirroring some of the same problems as the NASDAQ's chart, but it's got a few of its own as well. On the flipside, the S&P 500 also has the better shot at support, if any pullback takes shape.
First and foremost, like every index right now, the S&P 500 has been over-extended for several days. Once we finally broke past the clustered moving average lines on August 15th, the buyers never really looked back. Yes, they slowed down and regrouped from time to time, but not once did the SPX fall under the support at the 10 day moving average line (red). Well, it never fell under the 10 day line, until yesterday.
The dip also ushered in a new mode for the CBOE Volatility Index (VIX). Stuck at 12 for the better part of three weeks, the VIX finally broke free of its tight range, pushing up to yesterday's close of 13.74. While there's still the possibility the VIX could find support at the upper Bollinger band (at 14.79), considering that previous peaks have occurred at ir above 20, we don't see much possibility of that happening. Instead, we can foresee the VIX tracing a rising upper Bollinger band for a few days, much like it did in May and June. That, of course, will be bearish for stocks.
Additionally, note how a secondary support line (dashed) was breached with yesterday's tumble. The fact that it's so steep is a testament to how vulnerable the market is right now...we've not had to contend with a problem like this in a while. Of course, with yesterday's selloff, we got the first half of a stochastic sell signal. Even with only moderate weakness this week, we anticipate the completion of that signal.
That said, the bulls still have the added benefit of potential support from the combined 100 and 200 day moving averages, around 1277.And by the time they might become an issue, the 50 day line should be there as well. That's just a lot of potential support, so we wouldn't plan on any selloff going lower than that for the time being. If and when those lines collectively do break as support, then the bulls will have a real problem. In the meantime, the potential fall from 1300 to 1277 is still very trade-worthy.
S&P 500 Chart

Price Headley is the founder and chief analyst of BigTrends.com.