NASDAQ COMMENTARY
The trading week ended pretty quietly on Friday, with stocks hovering near break-even levels for the day. Investors seem to have gotten an early start on the three-day weekend, and stocks deserved some rest too. It was the fourth straight week of gains for the NASDAQ, although this week's rally wasn't as strong as the surge we saw last week. In fact, the composite may be even more ripe for a brief pullback now. Just keep it all in perspective.
That said, the NASDAQ gained 29.21 points last week (+1.4%). That tops off a fourth consecutive week of gains, for a total gain of 154 points since April 30th (+8.0%). It's the best month we've seen since November of last year, and the strength of the move has almost been bizarre compared to how many problems that stocks were facing just a few weeks ago. As is stands now, the market's next likely move is a short move lower, but only to give investors a chance to regroup before the next leg higher.
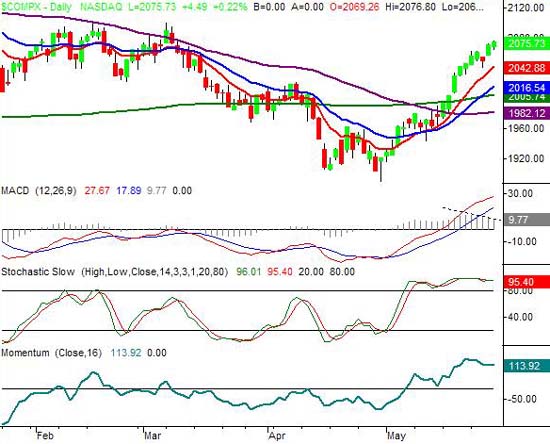
The fact of the matter is that the NASDAQ is well overbought. Admittedly, we said the same thing last week, but it was true then as well. Both stochastic lines were well above 80 then, and they're even more so now. So, the profit-taking pressures were already starting to build. After last week's gains, the market is even more ripe for that short-term correction. Even though the composite continued to tack on gains in the face of being overbought, we're now seeing clear evidence of the momentum shift.
Take a look at the MACD portion of the chart. The MACD difference bars (the vertical gray lines) are now getting lower......as indicated by the falling dashed line. This is an indication that - although stocks headed higher - the momentum is turning around. Stocks typically follow that lead a few days later. We're seeing a similar clue in the momentum line (bottom of chart). It's rolled over and is now headed lower. Overall, the bulls are getting tired and need a break.
As before, any dip should be temporary. All the longer-term signs still say the bigger trend is a bullish one, so view any dip as a buying opportunity for long-term positions, and a short-term bearish trading opportunity. As we mentioned last week, that target for the pullback is at the 10 day line (2042), and then the 200 day line (2005). The 20 day line is wedged in between those (at 2016), and may well come into play too. That's a pretty good sized pullback - anywhere from 30 to 70 points. But, after a 154 point run, that's not going to be unusual. We expect to find support at one of these moving averages, and once we do, we'll look for the uptrend to resume. The next resistance level, and target level, is at 2100, and then again at 2191.
NASDAQ CHART - DAILY

NASDAQ COMMENTARY - LONG TERM (weekly)
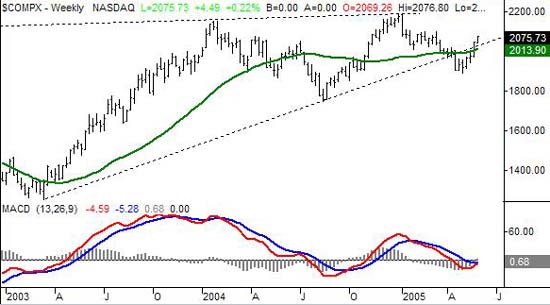
The fourth winning week in a row left us with a very important buy signal on the weekly chart. We can see a bullish MACD cross as of the end of the week on our chart below - something we haven't seen since September of last year. That's why we've been largely bullish in the bigger picture, despite the fact that we're looking for a small correction over the next few days. These weekly MACD crosses are no small matter, as they usually come in front of very big moves. Perhaps this summer will be unique in that it is very bullish.
NASDAQ CHART - WEEKLY

DOW JONES INDUSTRIAL AVERAGE COMMENTARY
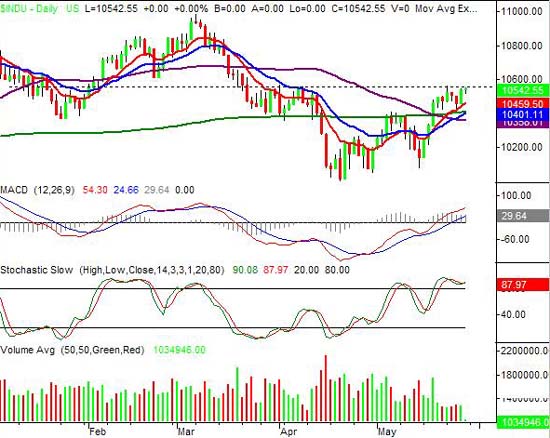
For the sake of variety, we'll look at the Dow Jones Average chart today. But the picture is about the same - the recent run has made things look pretty bullish, but has also set up some room for a brief pullback. In the case of the Dow, though, things are much less volatile (bullishly and bearishly). For instance, the Dow isn't that far removed from all of its key moving average lines. It's only 1.3 percent above the 200 day average, and even closer to its 10 day line. So any pullback here wouldn't be quite as bi as the one we're likely to see with the NASDAQ.
One roadblock that did pop up as of lass week was resistance around 10560. That's where the Dow topped out in mid-March after the big tumble, and that's as high as it could get last week. So, this is going to be a barrier. But like the NASDAQ, we don't think it will be an issue until we pull all the way back to the 10 and 20 day lines and regroup. We'll revisit it again in a few days.
In the meantime, we do want to point out that volume has been drying up. So far it hasn't been bullish or bearish, nor is it a surprise. We're now in the heart of summer....and slow trading. That will slow things down quite a bit as most investors are fairly distracted now. Generally speaking, this makes things slightly more bearish than bullish, but only because minimal activity keeps the buyers less interested, but the sellers are more likely to keep playing defense.
Support is at 10400, with resistance at 10560 and again at 11000.
DOW JONES INDUSTRIAL AVERAGE CHART

ECONOMIC CALENDAR

Price Headley is the founder and chief analyst of BigTrends.com.