It looks like the bulls have finally exhausted themselves. For several weeks now, the bulls have had things pretty much their way -- with prices advancing slowly and the technical indicators falling in line behind the move. However, as we warned last week, it wouldn't take much to swing these indicators over to a negative reading. It's too early to say if this is just a minor correction or the beginning of something bigger. Let's review the technical indicators.
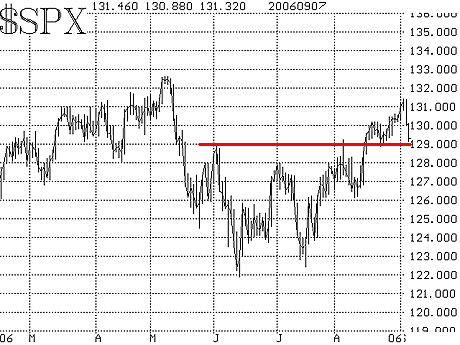
First, there's the major indices themselves. The S&P 500 Index ($SPX) has good support at 1290, so as long as it's above that level, it is bullish (the 20-day moving average is just above 1290 as well). However, it has gotten somewhat extended recently, so a pullback towards that support is perhaps warranted. The trend of $SPX is still up.

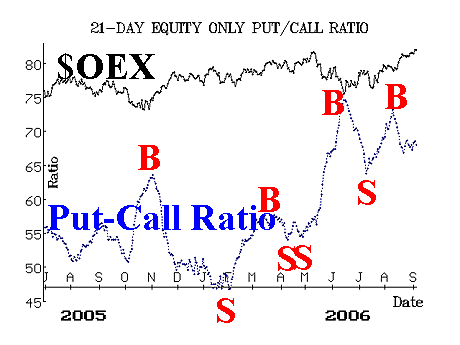
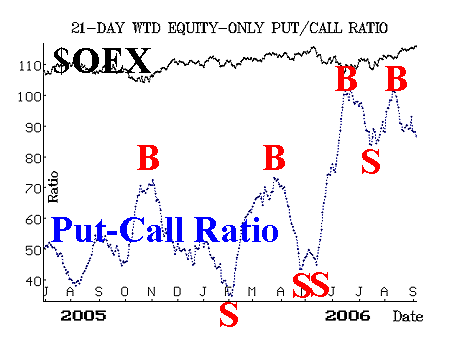
The equity-only put-call ratios have grudgingly remained on buy signals. That is, they are continuing to decline -- albeit slowly (see Figures 2 and 3). Also positive is the fact that they are rather high on their charts -- meaning that there is plenty of room below for them to decline, as would be the case in a longer, intermediate-term advance.


Market breadth (advances minus declines) had kept pace with the advance quite nicely. In fact, breadth has been fabulous (of course, it was also helped out by the fact that the bond market was advancing -- at least until very recently). As long as we're on the subject of the bond market, it's noteworthy that the stock market ran into trouble only after the bond market tumbled first.
Finally, there are the volatility indices ($VIX and $VXO). These had been disturbingly low, and -- as we warned last week -- it's okay as long as they stay low, but once they begin to increase, that is a negative sign. Tuesday, when the broad stock market was relatively flat, $VIX moved higher, and Wednesday it rose sharply, followed by another small gain on Thursday. This is a somewhat bearish development. There is no specific level that $VIX must attain to turn bearish, but since it's been up three days in row, we're concerned.

Overall, the market could still work higher, but it's been operating on vapors for a couple of weeks now and some selling is overdue. If it can withstand this current bout of selling without $SPX falling below 1290, then another rally attempt could easily develop. However, if that support level gives way, it could be setting up yet again another nasty September-October period.
Lawrence G. McMillan is the author of two best selling books on options, including Options as a Strategic Investment, recognized as essential resources for any serious option trader's library.