"The opera ain't over 'til the fat lady sings." And speech after speech by members of the Federal Reserve over the past few weeks suggest that the fat lady is still waiting offstage, not sure of her cue. Today we look at a thoughtful speech given last night to a private gathering by Richard Fisher, President of the Federal Reserve Bank of Dallas. We then look at a few worrisome charts on global liquidity and inflation and some more data on housing.
The Fat Lady Hasn't Sung
This Rice University graduate was invited to attend the Dallas Harvard Club last night, to hear a speech by Richard Fisher, President of the Federal Reserve Bank of Dallas. I went mainly for the company but was more than pleasantly surprised by Fisher's very thoughtful and interesting presentation. I have heard a few speeches from Fed officials, and sometimes they can only charitably be described as merely boring. Fisher is not. If you ever get a chance to hear him, you should.
For the next few pages, I am going to paraphrase some of his thoughts and material. I will do my best to get the spirit, if not the exact wording, of his presentation.
First, he made it very clear that he is concerned about inflation. His comments were very similar to two other Fed speeches this week, one in particular by Dr. Janet Yellen, the President of the Federal Reserve Bank of San Francisco. "Speaking in Boise, Idaho, Dr. Yellen said that she was concerned about recent inflationary pressures extant in the US economy, and that as a voting member who voted to hold rates steady at the last FOMC meeting, was prepared to move for further tightening if these inflationary pressures became of an even greater concern.
"Worse, she said that to bring inflationary concerns under control 'could take several years.' She said that she and others on the FOMC preferred seeing the personal consumption expenditures index between 1-2%, and that presently it was rising at an annualized pace of 2.4%. Clearly this is too high, then, and her propensity shall be to err upon the side of tighter rather than easier monetary policies going forward." (Courtesy The Gartman Letter)
A New Measure of Inflation
Interestingly, Fisher noted that the Dallas Fed has its own new calculation of inflation, called the "Trimmed Mean PCE Inflation Rate." Not having heard of it, I went online to check it out today. Turns out it was developed by a researcher at the Dallas Fed named Jim Dolmas. Essentially, he takes issue with the way the Fed calculates inflation. The favorite measure of inflation for the Fed is the core Personal Consumption Expenditures (PCE). The Fed then strips out food and energy, giving us a "core" rate of inflation, or core PCE. Why? Because the monthly food and energy numbers are so volatile that it can make the full PCE number quite volatile. Except that we all know we use food and energy, and inflation in those areas is quite real.
Dolmas notes as much in the introduction to the paper where he presents his work:
"Speaking of the challenge in interpreting monthly inflation numbers during his tenure on the Federal Reserve Board, former Vice Chairman Alan Blinder has said 'The name of the game then was distinguishing the signal from the noise, which was often difficult. The key question on my mind was typically: What part of each monthly observation on inflation is durable and what part is fleeting?
"Blinder's conception of a component of monthly inflation that is 'durable' as opposed to 'fleeting,' that represents 'signal' rather than 'noise,' corresponds to what most economists call core inflation. Core inflation, understood in this way, represents the underlying trend in inflation, once transitory swings have been smoothed out. Because what is transitory and what is lasting can only be known with the benefit of hindsight, the true core inflation rate for any given month cannot be known with certainty until well after the fact. In real time--as the data arrive and policy decisions need to be made--the best that economists can do is to estimate the core rate of inflation." You can read the paper at http://www.dallasfed.org/research/papers/2005/wp0506.pdf.
Dolmas notes (quite correctly, I think) that to exclude food and energy, just because they are volatile, ignores the other quite volatile measures of inflation that are still left in. Further, energy and food inflation do have meaning in the real world.
What Dolmas does is use a statistical device called "trimming." From the field of statistics, trim analysis borrows the idea of ignoring a few "outliers." A trimmed mean, for example, is calculated by discarding a certain number of lowest and highest values and then computing the mean of those that remain.
How accurate is his new measure? Dolmas suggests it is a lot more accurate: "That is to say, compared to the usual ... measure, on average the monthly trimmed mean measure would be expected to come closer to true monthly core inflation by roughly .75 of a percentage point, when the inflation rates are expressed in annual terms." That is huge, at least in my book, especially when we look at how much the difference is with the Fed's favorite methodology.
So what does this new measure show us? Fisher says that by their measure of trimmed core PCE, inflation was 3.1% in July (last month for which data was available) and not the 1.7% the Fed uses as core PCE. That is a big difference. Let's look at the tables from the Dallas Fed web site for the last 6 months. His research, by the way, shows that the 6-month inflation-trimmed core PCE numbers have the highest accuracy in gauging core inflation, and thus the tables below are for 6 months. (http://www.dallasfed.org/data/pce/index.html)
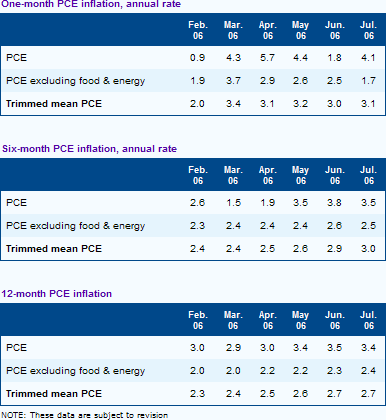
I really like what Dolmas has done. I think it makes sense. I doubt that it will become mainstream this cycle, because Bernanke and company will not want to use something showing higher inflation right now. By the way, this measure shows inflation did not get as low as everyone thought in 2003, dropping only to about 1.5% instead of below 1%.
What this data shows is that inflation has been slowly and steadily rising over the last six months, as opposed to falling, as the Fed's favorite measure has been. And Fisher made it clear that he is not comfortable with this trend.
No central banker, he told us, ever again wants to find himself in the position of Paul Volker, where he was forced to bring about serious and deep recession.
"Why then," I asked in the Q & A at the end of the speech, "was there only one dissenting vote at the last Fed meeting?"
He pointed that he was not a voting member at this meeting (the 12 Fed regional presidents rotate that responsibility). But he hastened to add that he agreed with the move to pause. Why? Because there is considerable lag between the time the Fed raises rates and the effect upon the economy. There had been 17 straight rate hikes, and it was time to see if those were going to have an effect.
But he made it clear that if inflation does not subside, the Fed would (not could!) take action in the future. There was no soft pedaling here. Clearly he understood the effects that such a move would have on the markets and the economy, but he was prepared to do so to keep inflation in check. And he clearly implied the rest of his colleagues agreed with him.
So, what does that mean? "We are data dependent," Fisher tells us. I think it is clear that they do not know what they are going to do. If inflation falls, they have finished raising rates for this cycle. If it does not, they are prepared to raise rates some more. They are gambling that a slowing economy will lower help lower inflation and remove the need for any further rate hikes. We will have to see what the data in the next few months shows us as to whether this approach is working.
Now, let me speculate. My sense is that they will look at the data in September, October, and November, before they decide whether to call in the fat lady for her finale. If inflation is still rising in November, they will likely raise rates at the December 12 meeting. The inflation numbers would have to be pretty bad to raise rates at the October 24-25 meeting in front of an election. The Fed does not have a political tin ear. Remember, this is my speculation and has nothing to do with Fisher's presentation.
This presages some market volatility, as the inflation numbers come out in the middle of every month for the preceding month. As an aside, just a few years ago, the CPI numbers came out before the PPI (Producer Price Index) numbers. Then a few years ago that order was reversed. Bill King tells me that this month they are planning to revert back to bringing out the CPI first. He does not know why. If anyone does know, I am curious as to the rationale.
The Money Supply Is Contracting
Fisher noted that about two-thirds of US cash currency is overseas, with two-thirds of the hundred dollar bills in Russia. And that brings to mind the US money supply. The one measure of money supply that the Fed actually has control of is M-1. M-1 is just one measure of the money supply, and includes all coins, currency held by the public, traveler's checks, checking account balances, NOW accounts, automatic transfer service accounts, and balances in credit unions.
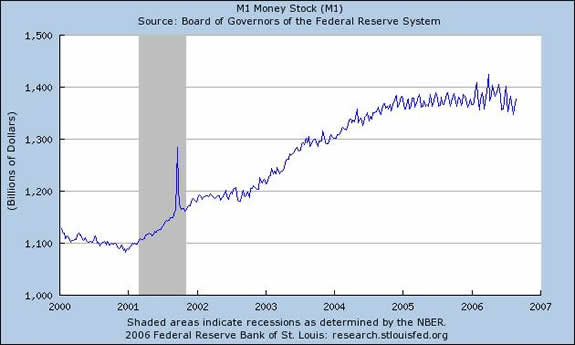
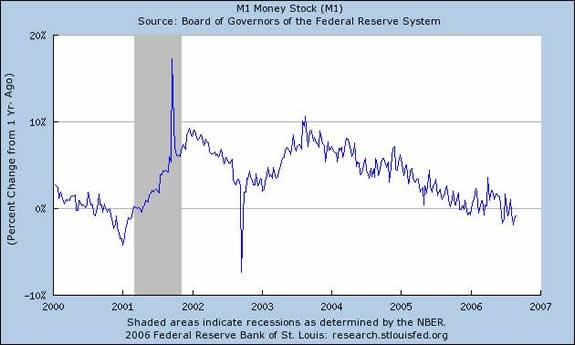
M-1 is not growing. In fact, it is actually contracting, as the charts below show. Further, the large majority of the additions to the money supply are physical cash; and cash is deflationary, and much of it ends offshore, effectively reducing our homegrown money supply.
As you can see from the chart below, the money supply has not grown since the middle of 2005. Further, the second chart shows that the money supply has actually fallen over the last year. This, sports fans, is another example of the Fed hitting the brakes. You don't contract money supply unless you are worried about inflation. In tandem with the rate hikes, it is another reason why the Fed is taking a pause to see if their efforts will slow inflation.
Notice that in 2003, when everyone was worrying about deflation, the Fed was clearly and significantly growing M-1. Then when inflation started to rise, they started to back off, and then in 2005 they started to hit the brakes.
(For the record, M-2, which includes money markets and other time deposits, is only growing around 5%, but the Fed does not have direct control of M-2, although they can influence it.)
A Warning for Politicians
Finally, Fisher referred to the national debt and growing social security and Medicare obligations. It is not the Fed's problem, and he flatly asserted they will not monetize the debt in the future. This is a political problem. Congress is going to have to get its own house in order. The Fed will not bring back inflation to accommodate a profligate Congress. He did not have kind words for the lack of spending control in Washington.
There is a probable push of debt coming to a shove of Fed willingness to force Congressional action in our future. Interestingly, the same events are effectively going to be happening in Europe a few years before our problems really kick in. We will get to see what works, or more likely, what doesn't.
The Japanese Current Account Balance Is Again Shrinking
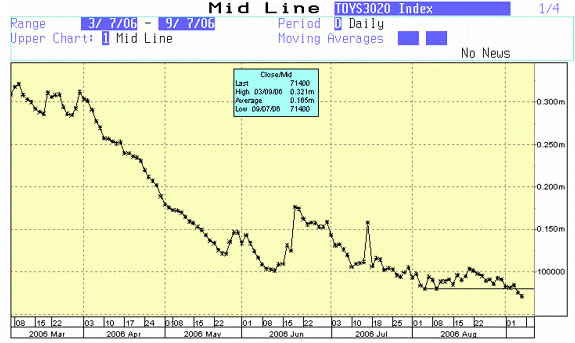
The next chart comes courtesy of Bill King. Readers will remember when I directly connected the contraction of the Japanese Current Account Balance last spring and the resulting fall in stock markets all over the world, as global liquidity dried up. In fact, the Japanese central bank has inflated their current account and then rapidly dropped it three times in the last 20 years, with each inflation giving us a bubble and each drop a crisis. You can see from the chart that the Japanese stopped the slide in June, and the stock markets of the world began to recover.
Since that time they have slowly reversed that increase, and over the last two weeks we have seen another drop. This is worrisome. The Japanese are a big part of the global money supply, and they are drying up liquidity at the same time that the Fed is slowing the rise in our money supply.
Consumer Spending Likely to Slow
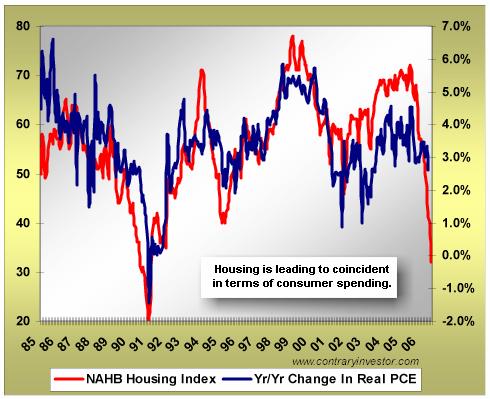
I have documented over the years the very strong correlation between the housing market and consumer spending. Housing is a lot more important than stocks or bonds as a driver of consumer spending. The following commentary and chart from my friends at www.contraryinvestor.com show that correlation does not bode well for consumer spending.
"Quite importantly, at least to us, the next little view of life is the NAHB [National Association of Homebuilders] data overlaid on top of the year over year change in real personal consumption expenditures. In other words, we're linking housing to consumer spending. As you can see, at least in the past, there has been a very high degree of correlation between the homebuilders survey and the direction of consumer spending trends. If indeed this continues to be true ahead, it sure as heck appears that a rate of change downtrend in consumer spending has just begun and may become a whole lot deeper before hitting some type of bottom. From current levels near 3%, we think it's fair to say that the forward year over year rate of change in real consumer spending could indeed drop to 1% or lower as we move forward."
If the US economy slows and consumers start to pull back, that means the trade deficit should improve. But be careful for what you wish. In the words of Charles Gave, "Because the US$ is still the reserve currency of the world, and because most trade exchanges are still priced in US$, a reduction in the US current account deficit is equivalent to a liquidity squeeze... Money becomes scarcer. Which is why, with each improvement in the US current account deficit, someone who is in debt and/or in negative cash, goes bust."
That means more tightening of global liquidity. Which is not good for equity markets. I repeat my mantra of the past few months. If the economy is slowing down, it is not good for the stock markets. If the economy is not slowing down, that means inflation is not slowing down either. The clear implication from every Fed speech we hear is that they will raise rates in the face of rising or problematic inflation. That will not be good for the stock market. I think we are going to get a chance to buy the market at a (probably much) lower price than it is at today. Be careful out there.
John Mauldin is president of Millennium Wave Advisors, LLC, a registered investment advisor. Contact John at John@FrontlineThoughts.com.
Disclaimer
John Mauldin is president of Millennium Wave Advisors, LLC, a registered investment advisor. All material presented herein is believed to be reliable but we cannot attest to its accuracy. Investment recommendations may change and readers are urged to check with their investment counselors before making any investment decisions.