NASDAQ Commentary
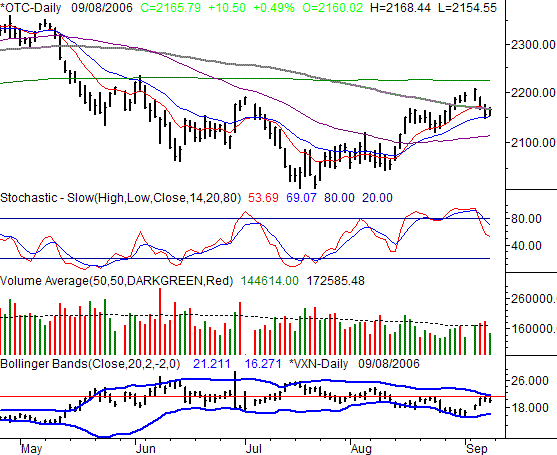
The NASDAQ Composite bounced by 10.50 points on Friday to partially offset a disastrous Wednesday and Thursday. However, the close of 2165.79 was still 27.67 points lower than the prior Friday's close, meaning we still took a 1.25% loss for the week. It was the worst weekly dip the NASDAQ has suffered since mid-July, but the degree of technical damage inflicted may keep us in the same mode for a while.
By the 29th of last month, the NASDAQ was about as stochastically oversold as an index can be. However, it didn't implode until Wednesday...the day after the composite reached a new three-month high. By Thursday's close, we had a full-bown stochastoc sell signal, with the first closes under the 10 day line in weeks.
Equally telling is the volume behind the bullish-vs.bearish tug-of-war. Each subsequent gain was coing on weaker volume, while each selloff - although a rarity for the better part of the last month - was being made on higher and higher volume.
Ironically, one of the most bearish factors we were preaching about a month ago may be one of the more bullish forces in place now - the VXN. Hovering at dangerously low levels for three weeks, we finally paid the price last week. The VXN broke past its resistance, as the NASDAQ broke under support. Just as quickly as it happened, though, the VXN ran into resistance again at its upper Bolinger band. In fact, the sharp, precise reversal we saw after the VXN hit the upper band on Thursday. Had it not also occurred right as the VXN was running into prior resistance lines, we may not have thought too much of it. But, we have to take charts - and historically important lines - at face value.
As for what's next, be patient now. The NASDAQ is trapped between resistance at the combined 10/100 day line, and support at the 20 day line. We'd like to wait two to three days before making a call, but this may well be a big bearish setup. Check back in the MidWeek report.
NASDAQ Chart

S&P 500 Commentary
Like the NASDAQ, the S&P 500's 0.38% rebound on Friday was nice, but not nearly enough to salvage the week. The large-cap index closed 12.10 points lower on a weekly basis (-0.92%). However, the first close under the 10 day moving average line since early August is a key bearish sign. On the other hand, the S&P 500's chart still presents the most bullish scenarios, all of which are conditional though.
The three-week old discussion regarding the VIX has changed slightly. As of August 18th, we considered the VIX 'too low', as it had rune into the lower Bollinger band. Now, although the VIX hasn't budged, the lower Bollinger band - the 'too low' level - is much lower. In other words, the floor was lowered. This now allows the VIX more room to sink...and by default gives the S&P 500 a little more room to rise.
That, however, doesn't change the fundamental problem - the VIX is still showing way too much complacency overall. VIX readings at or under 12 (like they are now) are associated with market tops. We don't think this one will be any different. The question is just one of when. We expected to see any correction by now, but so far, it hasn't happened. We still expect to see it. But, we no longer think it's going to be a major one. The S&P 500 is up by 6.0% over the last six weeks, so the bigger trend is undeniably bullish. As for any dip, the combined 100 day and 200 day lines at 1277 should be the worst case scenario. That would allow the VIX to bleed off most of it excess confidence, and relieve some (if not all) of the market's overbought pressure. However, it still doesn't answer 'when'. It should be soon, but we may need to retest the 2006 high of 1326 before we start such a selling spree. Or, a couple of closes under the 10 day line at 1300 would be the alternative sell signal.
In either case, the pullback should be trade-worthy. And, when and if we gat past 1326, we think the bullish rally will also be a big one. Anything between 1295 and 1325 is something of a no-man's land.
S&P 500 Chart

Dow Jones Industrial Average Commentary
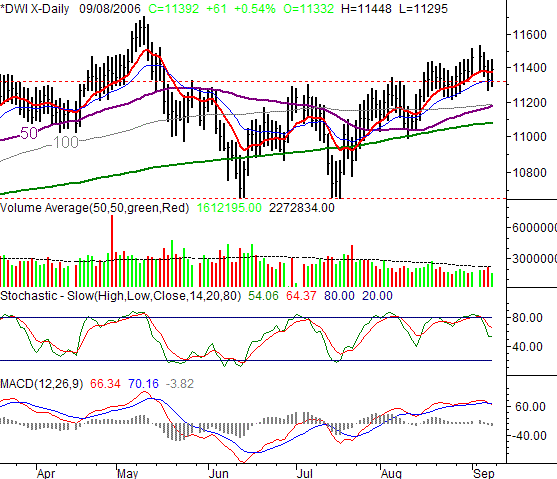
The Dow Jones Industrial Average actually saw the biggest gain in Friday, moving up by 0.54% (+60.67 points) to end the week at 11,392.11. But, even that wasn't enough to undo the selloff from the two prior days...the Dow still closed 72.04 points (-0.63%) lower for the shortened week. That, however was still the best (least weak) performance for the week -- something we had suggested a few weeks ago if you were looking to play defense, but still hold bullish trades. While the Dow chart still looks problematic, there are also a couple of bullish things worth a look. Needless to say, this makes the coming week a critical time, since whatever happens over the next few days has implications extending for a much longer time span.
Like the NASDAQ, the gains here are nice, but suspiciously lack volume. Plus, the momentum is waning now that we're back into overbought territory.
The Dow's bigger make-or-break level is this year's high of 11,709, but that's not quite on our plate just yet.
Dow Jones Industrial Average Chart

Price Headley is the founder and chief analyst of BigTrends.com.