Good day! The indices finally showed some smoother intraday trading on Monday. The morning began with a strong decline in the premarket that took the indices into that initial daily support. Well before the open, however, at 5:00 am ET, the market began to move higher again. This premarket rally continued into the 5 minute 200 simple moving average at 8:30 am ET on the all sessions charts of the S&P 500 and Dow Jones Ind. Ave. The Nasdaq remained somewhat more reserved. As the resistance hit, the indices began to slow. The S&Ps, in particular, began to pull back. This took the market into the open.
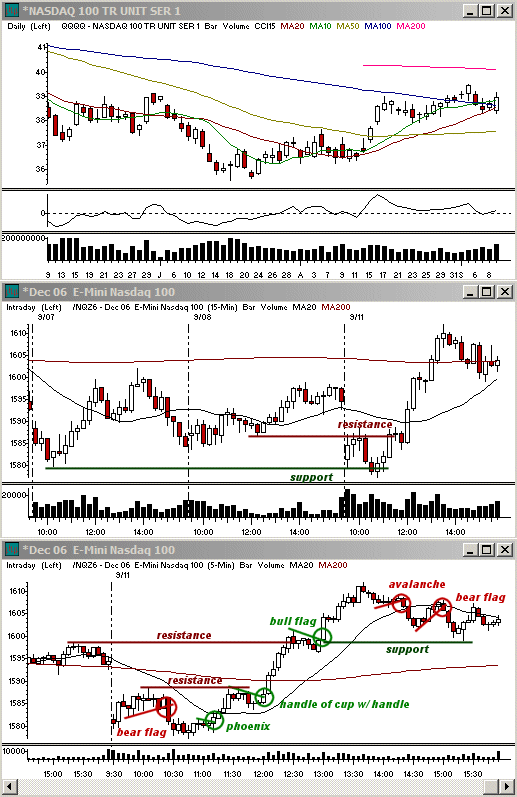
The opening trading was similar to the prior two trading days. The follow-through then took the shape of Thursday's trading. The trading range that formed immediately out of the open broke lower, selling off into 10:45-11:00 ET. As that reversal period hit, the indices began to round off, creating small buy patterns into lunch. The pace then increased until the market was back into the middle of the opening range. A bullish bias developed as the market hugged that upper resistance level, correcting gradually on lighter volume.
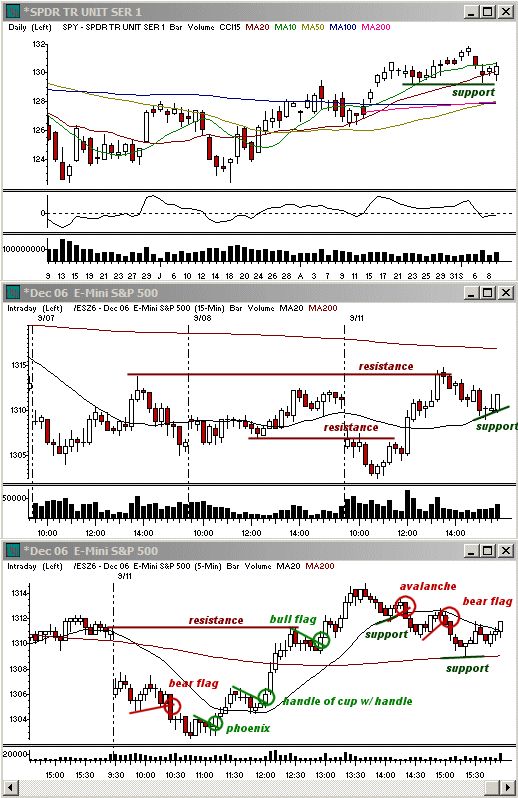
Once the 12:00 ET reversal period hit, the market began a second rally on the 5 minute charts. This is where the market diverged from Thursday and Friday's sessions. In those two cases the market reversed after the second upside move. The time it took only about half the time for the indices to base before the second rally began. This opened the door for three wave uptrend development as opposed to the two wave moves.
The second rally on Monday's 5 minute charts was stronger than the first one. It quickly reclaimed the gains lost with the morning gap, returning once more to Friday's closing price and the resistance that accompanied it. The second correction took place at this time, forming a small bull flag into the 13:00 ET reversal period before breaking out with the third rally on the 5 minute charts.
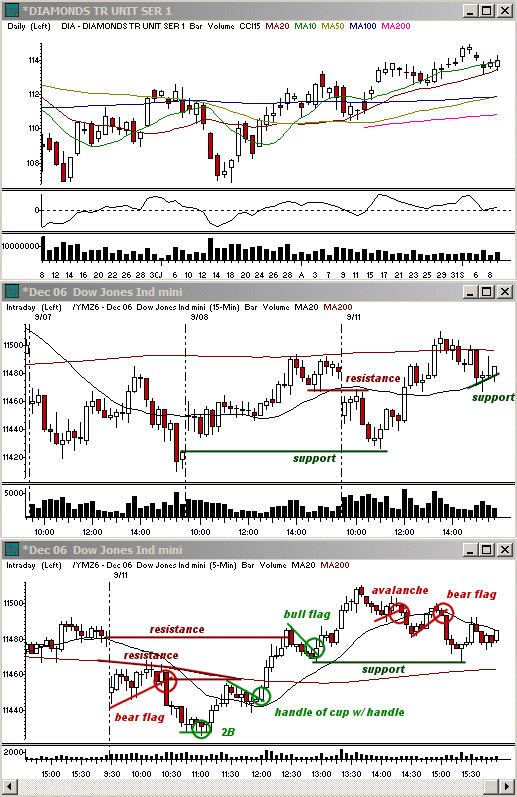
Following three upside moves, with comparable periods of correction in between (in this case about 30 minutes each), the market will then try to establish a larger correction. Since the prior ones were 30 minutes, this meant at least a 45 minute correction if it held the highs and simply based, or longer if the downside pace on the correction was stronger than in the prior two cases. The move began in a manner that was in harmony with the prior two pullbacks intraday. Once it hit that 30 minute chart though, instead of bouncing back into the zone of highs and falling into a range on the 5 minute charts, the market hugged the 5 minute 20 sma support zone. This created an Avalanche short pattern, which was then followed by a bear flag out of 15:00 ET.
Although the daily charts of the indices don't look like a lot took place, many daily setups took place on both the long and short side with strong follow-though. The metal and oil sectors were under the most pressure. The indices were also much smoother, allowing for easy timing of support and resistance for pivots, as well as intraday patterns with very minimal risk of getting flushed out. I ended up being as active in the E-Minis on Monday as I was on daily stock setups, if not more so. This had not been the case over the past two weeks when the indices had a lot more overlap from bar to bar intraday.
I am looking for continued upside on Tuesday, but this is due to the stronger upside pace the day before. The decline from the 6th will still remain a potential risk factor since it displayed an underlying concern that the rally of the past two months might begin a greater pullback at some point in the immediate future. The reversal in the last 120-180 minutes of the day is also not quite long enough to typically sustain another strong rally without still trying to pull back for another hour or two intraday, so this is something to watch for heading into Tuesday's session, so I am more comfortable with upside a little later in the day than right away out of the open.
Economic Reports and Events
Sept. 12: Trade Balance for July (8:30 am)
Sept. 13: Crude Inventories 9/8 (10:30 am), Treasury Budget for Aug. (2:00 pm)
Sept. 14: Business Inventories for July (8:30 am), Export Prices ex-ag. and Import Prices ex-oil for Aug. (8:30 am), Initial Claims 9/9 (8:30 am), Retail Sales for Aug. (8:30 am)
Sept. 15: Core CPI and CPI for Aug. (8:30 am), NY Empire State Index for Sep. (8:30 am), Capacity Utilization and Industrial Production for Aug. (9:15 am), Mich. Sentiment-Prel. for Sep. (9:50 am)
Earnings Announcements of Interest
Only stocks with an average daily volume of 500K+ are listed. List may not be complete so be sure to always check your stock's earnings date before holding a position overnight.
Sept. 12: BBY, ENER, GS, PLL, KR
Sept. 13: LEH, XLNX
Sept. 14: ADBE, BSC, PIR, TEK
Sept. 15: -
Note: All economic numbers and earnings reports are in lines with those compiled by Yahoo Finance. Occasionally changes will occur that are made after the posting of this column.
Toni Hansen is President and Co-founder of the Bastiat Group, Inc., and runs the popular Trading From Main Street. She can be reached at Toni@tradingfrommainstreet.com.


 Free Festival of Traders Videos