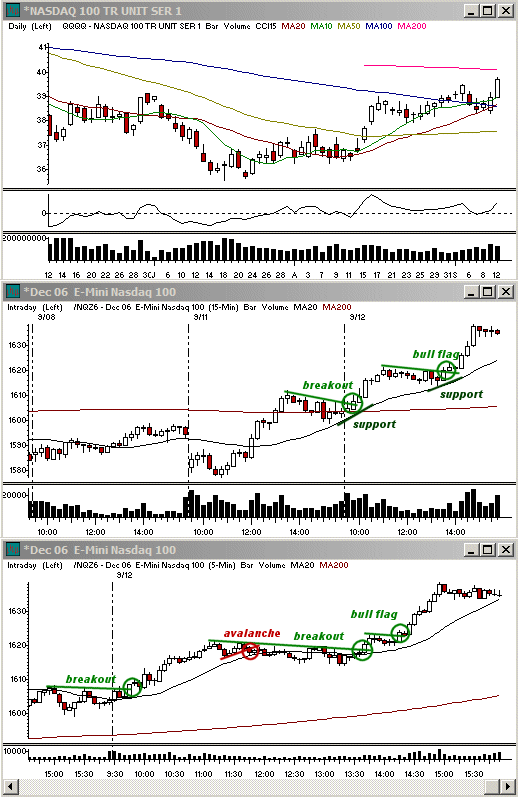
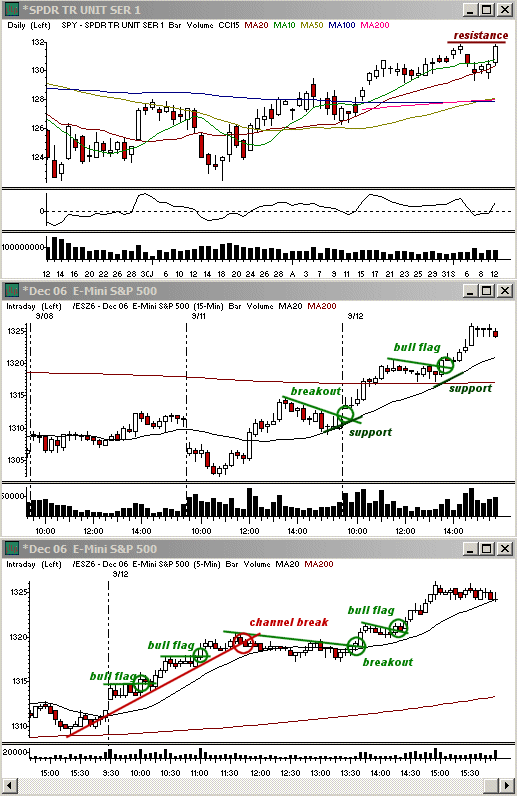
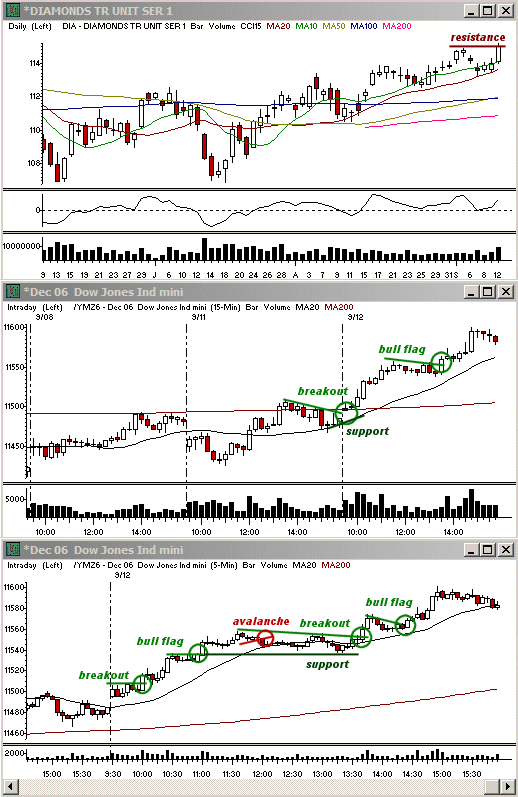
Good day! After nearly a month of ho-hum trading, the indices finally showed some gumption on Tuesday, rallying throughout the session on higher volume. Oil, utilities, energy, and gold remained weak, but many sectors accomplished their strongest intraday moves in months. The upside really began on Monday with a mid-day burst of strength before correcting into the close. I was initially expecting that base to continue a bit longer into the open, essentially forming the upside continuation pattern we saw mid-day on Thursday and Friday. Instead it took Monday's three waves continuation and expanded it to the 15 minute charts. The shorter relative correction into Monday's close broke higher nearly right out of the gate on Tuesday. Among the top performers were the semiconductors (+3.8%), networkers (+3.8%), home builders (+3.8%), transportations stocks (+3.3%), and brokers (+3.2%).

The buying remained fairly steady throughout the morning, pausing a few times on the 1-2 minute charts, but it continued until the S&P 500 and Dow Jones Ind. Ave. both put in a move equal to the upside from Monday on the 15 minute charts. It was only then that the market began to correct on the larger time frames. The mid-day correction manifested itself in the form of a trading range with only a lightly retracement in price before hitting the 15 minute 20 sma support zone that held the market the prior afternoon. By the time the typical afternoon breakout zone between 1-2 pm ET rolled around, the market was ready to try again.

The indices established a third wave of buying on the 15 minute time frame that lasted until the 3:00 ET reversal period. A small 5 minute bull flag helped out into 2:30 ET, and the S&Ps and Dow were soon hitting prior highs on the daily charts while the Nasdaq Composite cleared last week's levels. Strong volume accompanied the move, providing confirmation that will make it more difficult for the bears to regain a foothold for the time being. The Dow ($INDU) gained 101.25 points, the S&P 500 ($SPX) rose 13.57 points, and the Nasdaq ($COMPX) climbed 42.57 points by the end of the session.

With numerous upside breakouts on the daily charts, we should see a continuation of this move as the week progresses. The Nasdaq's 200 day simple moving average will serve as the next resistance level. As we saw on the 5 minute charts Monday, three waves of upside, whereby the time of the corrections between each of the moves is comparable, have a tendency to then fall into a longer correction after that third move. This will make it more difficult for the buying to continue too far into the open on Wednesday and raises the odds for a narrower session with more pivot/reversal patterns, as opposed to strong trend continuations.
Economic Reports and Events
Sept. 13: Crude Inventories 9/8 (10:30 am), Treasury Budget for Aug. (2:00 pm)
Sept. 14: Business Inventories for July (8:30 am), Export Prices ex-ag. and Import Prices ex-oil for Aug. (8:30 am), Initial Claims 9/9 (8:30 am), Retail Sales for Aug. (8:30 am)
Sept. 15: Core CPI and CPI for Aug. (8:30 am), NY Empire State Index for Sep. (8:30 am), Capacity Utilization and Industrial Production for Aug. (9:15 am), Mich. Sentiment-Prel. for Sep. (9:50 am)
Earnings Announcements of Interest
Only stocks with an average daily volume of 500K+ are listed. List may not be complete so be sure to always check your stock's earnings date before holding a position overnight.
Sept. 13: LEH, XLNX
Sept. 14: ADBE, BSC, PIR, TEK
Sept. 15: -
Note: All economic numbers and earnings reports are in lines with those compiled by Yahoo Finance. Occasionally changes will occur that are made after the posting of this column.
Toni Hansen is President and Co-founder of the Bastiat Group, Inc., and runs the popular Trading From Main Street. She can be reached at Toni@tradingfrommainstreet.com.