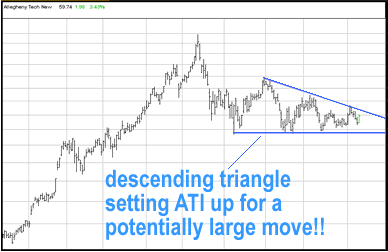
I keep a fairly close eye on Allegheny Technologies (ATI). I noticed a while back that there was a potential descending triangle forming on the 9-month daily bars chart. I continued to monitor the chart and sure enough, the formation has continued and we are at a point where a break could happen very soon.
Now, in approximately 8 out 10 cases, a descending triangle will break throughout the bearish side of the triangle, in this case represented by support at 55. Occasionally you will get a break out of the bullish side, which would mean a break of downtrend line resistance. In the event there is no break of the triangle before it is three quarters complete, the technical formation is null and void.

If we do see a bearish or bullish break before three quarters completion, the size of the move is measured by the price distance between the start of the triangle, 71, and the support line, 55. This equates to a potential move of 16 points in the stock price.
I am a fan of ATI as a company from a fundamental standpoint, and by no means do I feel a 16 point move below 55 is warranted. We may be setting up for a bullish break here.
Andy Swan is co-founder and head trader for DaytradeTeam.com. To get all of Andy's day trading, swing trading, and options trading alerts in real time, subscribe to a one-week, all-inclusive trial membership to DaytradeTeam by clicking here.