NASDAQ Commentary
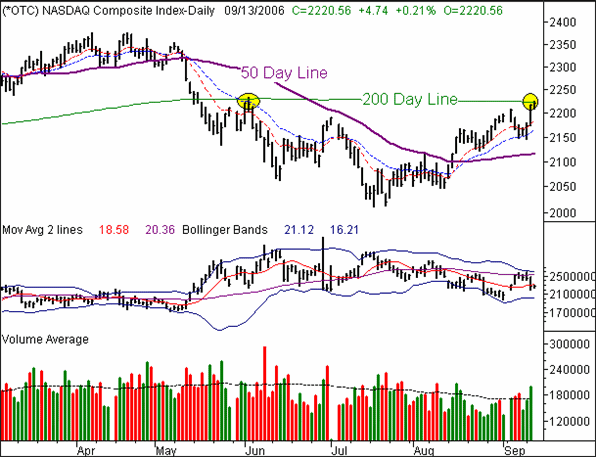
We'll say this much for the bulls -- they're persistent. The NASDAQ is up again today, to the tune of 0.21%. The current reading of 2220.56 is 4.74 points above Tuesday's close, and 54.77 (+2.53%) above last Friday's close, thanks, to a huge rally yesterday. However, don't get too excited yet. The NASDAQ has one last barrier to breach before defying the odds and turning bullish. And, it's a biggie.
As you'll recall from previous updates, the odds favored a dip this week for the market. The bulls ended August with a vengeance, but September got off to a weak start when everyone realized how overbought stocks were. The dip carried the NASDAQ all the way from 2205 to the 20-day moving average line, or 2150. That, however, was the end of the road for the sellers - the same 20-day line sparked a bounce last week, and we've seen some follow-through (so far) this week. And, in the interest of full disclosure, the bullish volume behind the recent gains has been respectable, for a change.
However, there's still one major roadblock for the bulls, and we're not surprised to see it come into play today. As we mentioned last week, the 200-day line is at 2225. Today's high is 2224.52. Coincidence? Doubtful.
There's really not much to add here. The 200-day line is the inflection point. If we can get a couple of closes above it, we have no choice but to be bullish. If instead we struggle here and give traders a chance to dwell on the fact that stocks are overbought, we'll tumble. So (although needles to say), keep an eye on where we are in relation to 2225.
By the way, the VXN has some room to fall before running into potential support, enough room to allow the NASDAQ to creep above the 200 day average before finding a floor. The VXN is currently at 18.19, while the lower Bollinger band is at 16.21. As always, the VXN is the trump card that can easily undo any other technical read.
NASDAQ Chart

S&P 500 Commentary
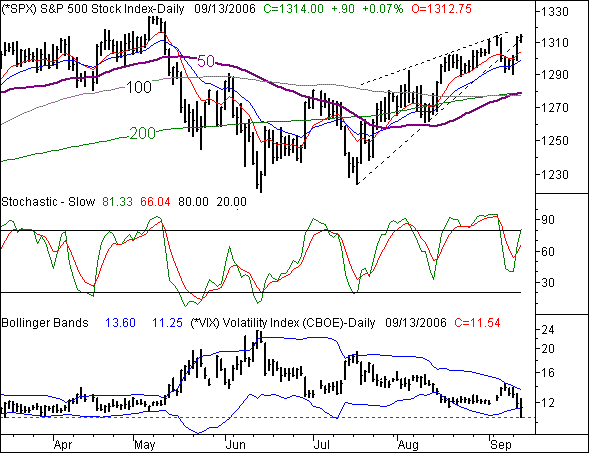
The S&P 500 isn't faring quite as well as the NASDAQ is today - it's only up by 0.07%, or 0.9 points. At 1314.00, we're ahead of Friday's close by 1.16%, or 15.10 points. While any gain is technically bullish, the SPX is waving a big red flag we're not even going to think about ignoring.
To give credit to the bulls, the buyers did a good job of building on the support at the 20 day moving average line (blue) to snap the losing streak and put the SPX back in its uptrend. However, the move puts us right back where we were...literally, and figuratively. In the literal sense, today's peak of 1315 is basically the same peak from September 5th - the day right before the carnage started. Is there resistance there? In the figurative sense, we're now headed back into stochastic overbought levels, where the selling pressure can start to kick in.
The danger, however, still lies in the VIX. In fact, as of today, the VIX is about as dangerous as it's been in months. Why? It hit a new six-month low when it tagged 10.54 this morning. It got to 10.53 on March 14. Had it not been for that day, the VIX would have actually hit a nine-month low.
Why is it bearish? We'll answer the question with a question...are things this much safer/bullish/better now than they were just three months ago when the VIX was above 20? The answer is no. That's not our judgment or opinion - it's just a reality. And, it doesn't change the fact that we have to deal with "what is," and not "what should be." As it stands right now, traders are oddly confident, much like they were in March and April - right before the market got whacked.
On the other hand, stocks have been defying the odds for days, so we're not going to the uptrend. Just know that the uptrend is very vulnerable. Until other players start to see that, however, it won't matter. We're only about 10 points away from new highs for the year (1327). If the SPX can get past that mark, the odds then favor an upside continuation, and the VIX's issue will be tabled - at least for a while. However, those last 10 points are also going to be a tough 10 points to squeeze out from current levels.
And on a side note, this Friday is a triple-witching expiration. It's very likely the effects of this month's option expiration could be skewing the VIX readings. All the same, discipline dictates that we continue to read the VIX at face value.
S&P 500 Chart

Price Headley is the founder and chief analyst of BigTrends.com.