NASDAQ Commentary
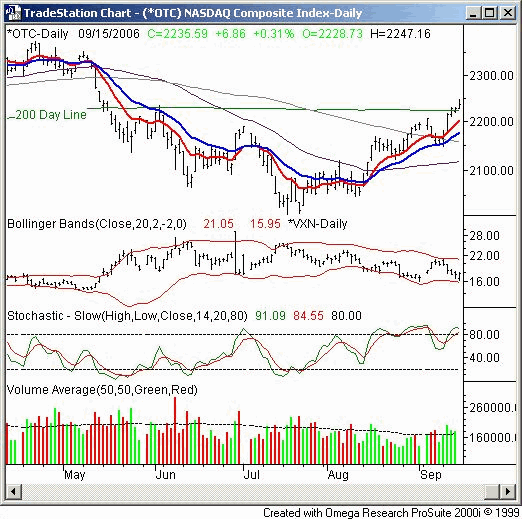
The NASDAQ Composite found another 6.86 points on Friday to gain 0.31%. For the week, the close at 2235.59 was 69.80 points higher (+3.22%) than the prior week's close. But perhaps bigger than bullish move was the fact that the NASDAQ managed to finally close back above the 200 day moving average. In fact, we saw three consecutive closes above the 200 day line, each of them slightly higher than the last. That's bullish, but is there something else that could undo last week's breakthrough?
There are two potential problems with last week's rally. First, the triple-witching expiration week may have skewed things considerably. There's no real way of knowing how or if it did, but considering this week followed a moderately bearish week, we have to wonder what changed (especially knowing September is historically a weak month). If it was indeed triple-witching at work, then we also have to wonder if things are set to fall again, since the expiration is now history.
The other issue is even more ambiguous, but we also think it's possible that this past week was just a wave of short covering. Once things settle down, and the short covering dries up, we have to wonder if the bulls will chuck it again.
On a more technical (and specific) note, take a look at how low the VXN is again. Even if the expiration week drove the VXN lower, it's still too low. As we've seen too many times recently, a low VXN inevitably leads to a substantial pullback. The question is just one of when. Plus, being stochastically overbought again, the pressures are really weighing in.
On the flipside, breaking above key moving averages is still breaking above key moving averages. To topple the 200 day moving average line is a big deal. So, here's how to play it...at this point, buying into the rally now is dangerous. No matter what, let's wait and see what happens when we pull back to the 20 day line (blue) at 2178. That's where we bounced last time, and that's our make-or-break line this time. If we can find support there and bounce again, then this rally would be much safer. If it's not support - and the NASDAQ falls under it - then the next likely support level is the 50 day line at 2118. Keep in mind that either way, the composite will have to slip back under the 200 day average.
NASDAQ Chart

S&P 500 Commentary
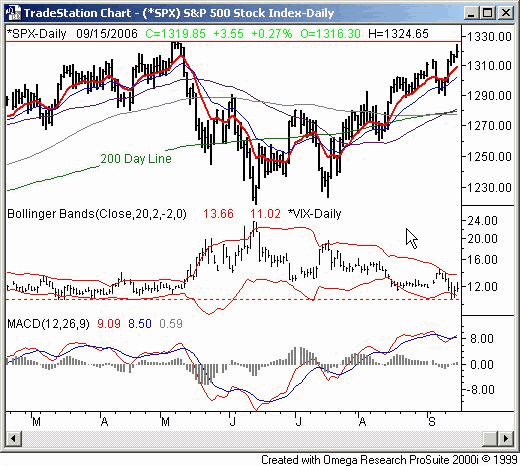
The S&P 500 moved to 1319.85 after Friday's 3.55 point (+0.27%) move. For the week, the large-cap index gained 20.95 points, or 1.61%. It was already over all of its key moving averages, so there was no new ground to break there. But, there is an interesting potential resistance line right in view now, and breaking past it could mean new highs for the year. The odds don't favor getting past it, but if we do, the celebratory rally could be huge, despite the odds.
The key line we're watching right now is at 1326 (and change). That's where the SPX hit highs for the year back in May, right before it all came crashing down. Friday's high of 1324.65 is just a fraction under there, so needless to say, tensions are high. If the market is going to implode, we're pretty darn close to getting to that point. Watch closely.
The trump card, of course, is the VIX. Like we mentioned in the NASDAQ's discussion above, a triple-witching could have skewed the VIX just like the VXN. But, seeing it come up and off that lower Bollinger band is still a worry. Forget the reason - complacency is dangerously high, evidenced by a dangerously low VIX. Something's got to give. Yet we still can't deny this past week as bullish.
As with the NASDAQ, the best move here may be to wait and see what happens when and if we get past 1326. If we struggle around here, don't be shocked to see a dip all the way back to the 50/100/200 day lines around 1280 (we think the 20 day line is getting tired as support, when it actually is). If instead we break past 1326, the bulls may just not be worried about the risk.
S&P 500 Chart

Dow Jones Industrial Average Commentary
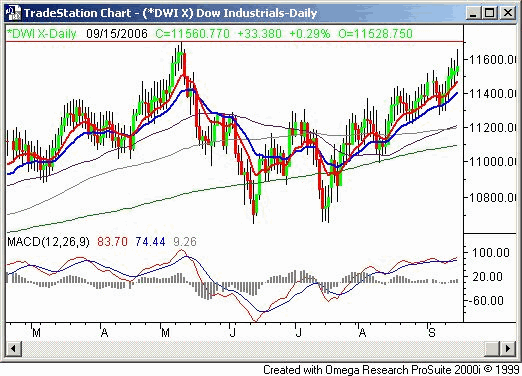
The Dow Jones Industrial Average edged the S&P 500 slightly on Friday, gaining 0.29% (+33.38 points) to end the session at 11,560.77. For the week, the Dow gained 168.66 points, or 1.48%. The Dow is also just a hair under new highs for the year, or 11,709. But, like the rest of the indices, the Dow has been riding on luck a little too long. The close on Friday was a little weak, and the weekly gain may have been a little artificially inflated. We'll have to see how it plays out. As with the other indices, a strong break past 11,709 would overcome most of the potential problems we see now. Support - if needed - would ultimately be around 11,200, where the 50 and 100 day lines are converged.
Dow Jones Industrial Average Chart

Price Headley is the founder and chief analyst of BigTrends.com.