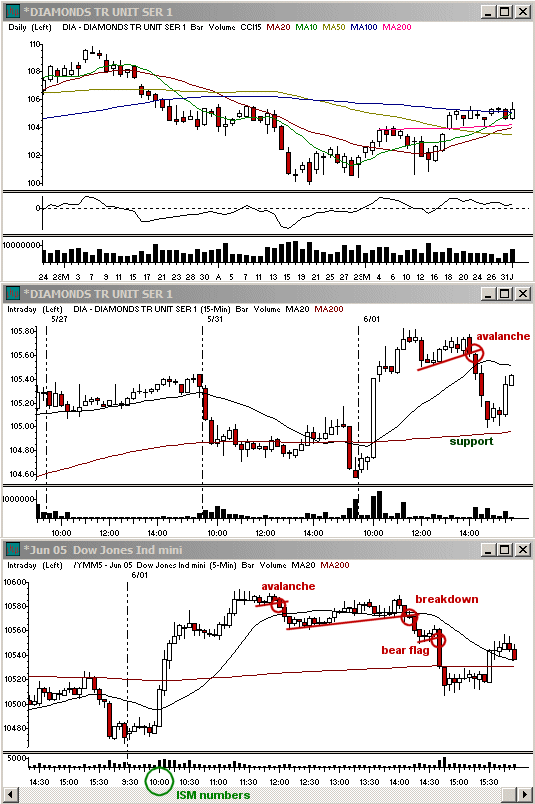
Good morning! The day got off to a slow start on Wednesday on this shortened trading week. For the most part participants seemed to be awaiting the 10:00 ET ISM numbers. These actually came out worse than expected, dropping to 51.4% in May off the 53.3% in April. While factory activity was lower, it was still above the 50 mark, which was a strong concern. This relief helped to fuel a strong rally out of 10:00 ET with very little notice ahead of time. As such, it was a difficult move to catch unless you just decided to jump onto the moving train.
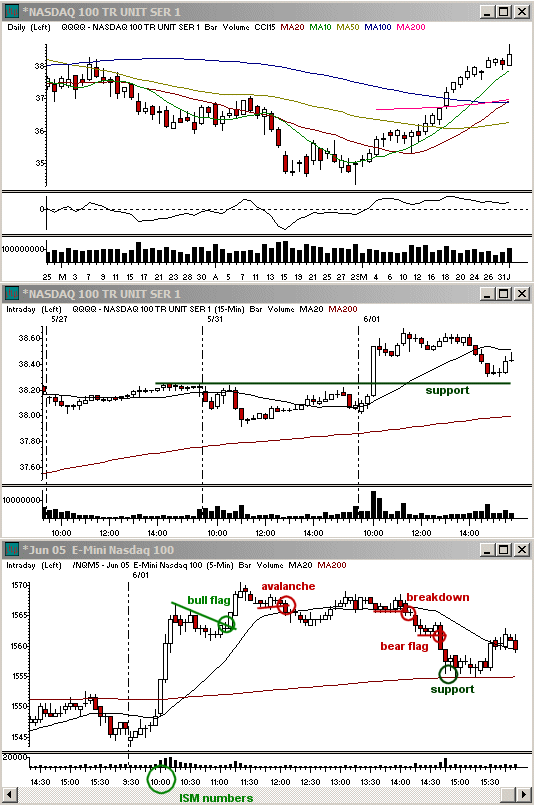
The morning rally was much steeper than usual, taking the indices sharply to new highs over the last two months. This included the NASDAQ, which had been wrestling with the prior highs from March for a few days. This really put a damper onto my bearish outlook intraday but helped out with a lot of the daily buy setups we saw going into the week. It wasn't until about 30 minutes later that the market rounded off a bit at highs and pulled back to form a 5 minute Bull Flag. This was not a terribly obvious flag since the SP500 and Dow had both starting rounding off, making the NASDAQ pattern the most easily recognizable as volume dropped off nicely into 11:00 ET.
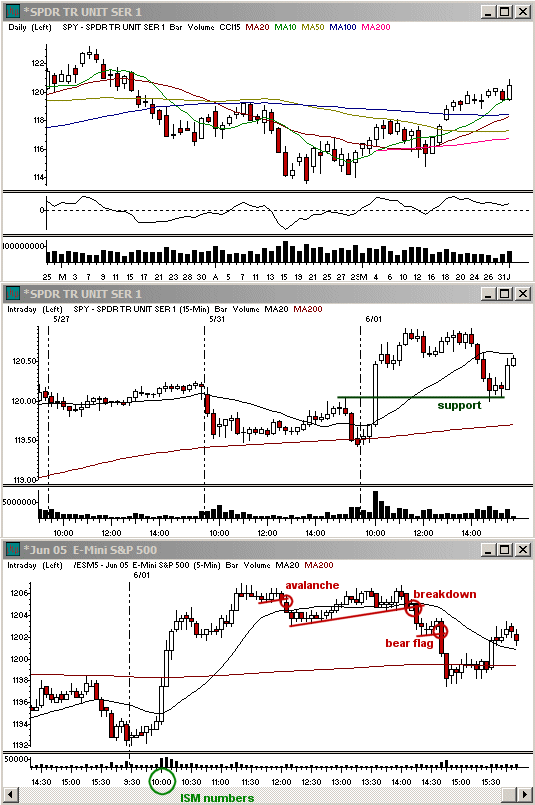
The 11:00 ET bull flag led to new highs once more intraday on Wednesday. Since the initial move was much greater than average, however, a continuation was not able to mount enough steam to continue into the afternoon. We started to see the market slow down into about 11:30 ET and the market created a small 2 minute Avalanche at that time, breaking lower out of the 12:00 ET reversal period and taking the market back into the zone of the 5 minute Bull Flag breakout from the 11:00 ET level. Since pace was starting to turn over to favor the sellers, I began to look for a shorting opportunity.
The market initially began to form a 5 minute Bear Flag into 13:00 ET, but the pattern never triggered and the market held the range until the 14:00 ET reversal period. It was only after this hit that selling came in earnestly. The selloff found initial support at the lows from late morning and into early afternoon. This stalled the market and created a base into the 2 minute 20 sma when this Bear Flag also gave way to more sellers. This strong drop took the NASDAQ into the 5 minute 200 sma support that managed to hold from that point on into the close.
The daily charts are continuing to lack strong patterns in either direction as the remainder of the week rapidly approaches. We have seen this for about two weeks and the market has formed a few decent intraday patterns, but continues to give a great deal of whiplash to those looking for swingtrades in the indices. I still think we need to correct more to the daily resistance, but will continue to trade more defensibly this week, much as I have since last.
AAP from the $51.88 zone on the 4/25 is correcting a bit on the daily after two strong weeks. Highs of $60.24. Trailing stop initiated for position trades. ASKJ on the weekly charts has also broken higher into $31.30 from 5/18. LCAV triggered a continuation on Friday over $41.50, higher than the prior day due to the gap. It hit highs of $45.35. Some trailing stops hit. CI triggered on 5/26 with the break of $97.55 and hit highs of $99.10. It held the 20 day sma on Wednesday and trailing stops can be under those lows. UNH, RT and GR triggered on Wednesday. On the short side, WEN formed a 2T on the daily charts on Tuesday and broke lower, closing near those lows on Wednesday at the 15 minute 20 sma support. Yesterday highs are now resistance that needs to hold.
Economic Reports and Events
Jun 02: Initial Claims 05/28 (8:30 am), Productivity-Rev. for Q1 (8:30 am), Factory Orders for Apr (10:00 am)
Jun 03: Average Workweek for May (8:30 am), Hourly Earnings for May (8:30 am), Nonfarm Payrolls for May (8:30 am), Unemployment Rate for May (8:30 am), ISM Services for May (10:00 am)
Jun 06: -
Jun 07: Consumer Credit for Apr (3:00 pm)
Earnings Announcements of Interest:
Only stocks with an average daily volume of 500K+ are listed. List may not be complete so be sure to always check your stocks' earnings dates before holding a position overnight. (A) = Earnings after the close, (B) = Earnings before the open, (?) = Earnings time not specified at the time of this writing
Jun 02: CIEN (B), TTWO (A)
Jun 03: SFD (?)
Jun 06: CMGI (A), ZQK (?)
Jun 07: ABS (?), COO (A), TOY (?)
Toni Hansen is President and Co-founder of the Bastiat Group, Inc., and runs the popular Trading From Main Street. She can be reached at Toni@tradingfrommainstreet.com.


 Free Festival of Traders Videos