After a brief hiatus, we're finally willing and able to jump back into the mainstream sectors today, as opposed to the highly-specific (and occasionally obscure) industries we've been forced to drill-down into over the last few weeks. Today's sector, however, is still a bit ambiguous. The consumer discretionary stocks - or cyclicals, to some - have managed to finally come back to life.
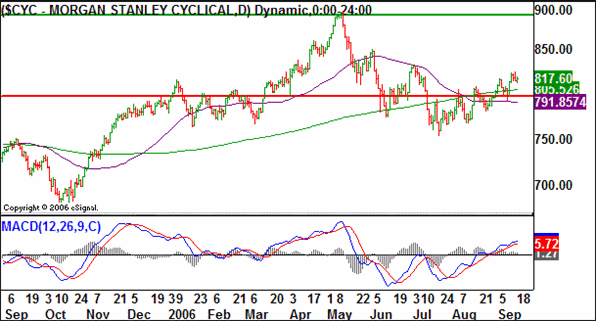
Our proxy for the consumer discretionary sector is the Morgan Stanley Cyclical Index (CYC), which was up 2.42% last week, and is 7.6% higher than its July 21st (weekly) bottom. For comparison, the S&P 500 was up 1.6% last week, and has only gained 6.4% since the week of July 21st. The two-month difference may not be all that dramatic, but the one-week (and three-week) disparity is actually quite telling...meaning the cyclical stocks are just now starting to really accelerate.
The technical buy signal here is the recent cross above the 50 and 200 day moving average lines. Both lines had been resistance at some point during the demise of the index back between May and July. However, the bullish MACD cross from early August (paired with enough upside follow-through to get these stocks back above their key long-term averages) tips the scales to the positive side of things.
However, that's not the only attractive part of this chart. Look back to the May-June-July dip. Between May 10th and July 21st, the index lost 14.5%. The S&P 500 during that time only lost 6.4%. Point being, the cyclical stocks were considerably more undervalued with that correction than most other stocks. In turn, the 'bounce potential' is far greater with this sector, even after factoring in the last couple weeks worth of better relative strength.
The only catch is the market itself. If all stocks can continue to go higher, then we'd expect the cyclicals to keep leading the way. If the market falters - and it looks like it might - then the cyclicals may not even fare well enough to stay in positive territory from here. All the same, since we always have to assume the trend in motion will stay in motion until proven otherwise, we have targets and stops for this chart. The upside potential would be fully tapped at 900, while our stop on this bullish bias would come with any close under 800. That's the exact middle between the 50 day and 200 day moving average lines.
Morgan Stanley Cyclical Index (CYC) - Daily

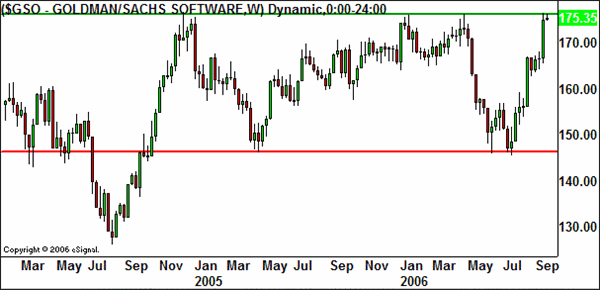
Since it wasn't a 'call' in the traditional sense, we couldn't really highlight it. But, we do want to point out that the CBOE Software Index (GSO) is now at a major crossroads. After hitting a low of 145 in April of last year, we weren't surprised to see it bounce off that line again in July. Conversely, the reason it tumbled to that 145 level in the first place was the third encounter with the 176 area...with the last one occurring in April of 2006. Well, the bounce off of 145 was strong enough to push the index right back up to 176, making it the fourth encounter there, but still no breakthrough. Clearly some traders are expecting 176 to be the end of the road yet again. We're not quite as sure, but in either case, this set-up should make for an interesting trade. A bearish breakdown would lead to the bigger (net) move, but the software stocks are known for closely following the lead of the broad market. So, if things remain bullish, the breakout for software move could be good-sized too.
CBOE Software Index (GSO) - Weekly

Price Headley is the founder and chief analyst of BigTrends.com.