NASDAQ COMMENTARY
Traders got back from the long weekend in a selling mood, or so it would at least seem as of yesterday. They made a U-turn overnight though; the NASDAQ has more than recovered all of yesterday's substantial losses. As much as were due for a pullback, clearly the bulls think otherwise.
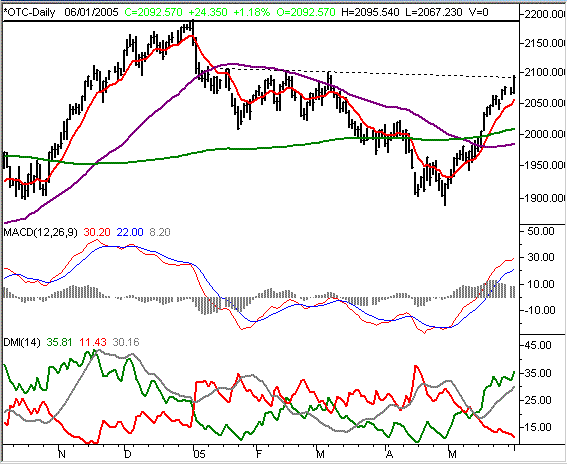
An important milestone has been reached for the composite. Going back all the way to mid-January, we can plot a resistance line (dashed) that was verified a couple of times in Q1. After getting crushed in March and April, we stopped drawing it since it wasn't even part of the picture. Now, it is again. The NASDAQ composite has pushed slightly above it today, but it does appear to be something of a barrier. It's right at 2092, and falling. We may or may not cross above it today, but in either case, this will remain our short-term line in the sand, so to speak. Breaking above it (more a matter of when instead of if) would be bullish. It could be this week, or if the market pulls back and regroups like we thought it was going to, it may not occur for a couple of weeks.
To refresh your memory, we were looking for a mild dip at some point in the near future based on the uncanny rally we've seen over the last four weeks. The bulls had basically gone unchecked, which typically means the bears are just biding their time. The thing is, the bulls are still controlling this market, and don't seem to have any intention of letting go. This is the first time we've seen this in months, which is largely why we were expecting the correction we've gotten used to in the early months of this year. But now, the tone has changed a great deal. We've been bullish for a couple of weeks, but wanted to buy on a dip. We now have to come to terms with the fact that we may not get any dip to buy......at least not a significant one.
While it may be a bit premature to bring it up, we do want to point out the possible upside down head-and-shoulders formation the NASDAQ has made since February. The neckline is - lo and behold - the same resistance line that also extends back to February. The first shoulder was most of February, the head, of course, was the tumble to 1890 in April. And the second shoulder is not yet made. It's this potential third shoulder that has kept us thinking we're due for a pullback before breaking above that resistance line. It's also why we're bullish in the bigger picture whether or not it was actually completed. If the NASDAQ breaks above 2092 it will be bullish. But even if the composite finds resistance at 2092 (for now), there's still all kinds of support at the moving average lines. Pulling all the way back to the 200 day line at 2008 would only complete that second shoulder, and set up the rally point for the rally past 2092. Either way, in the grand scheme of things, the NASDAQ chart looks bullish.
The upside target is 2190, or the most recent high from the beginning of the year. But, that won't be in effect until the resistance/neckline is broken. Support at 2055 (10-day line), and again at 2008 (200-day line). Note that even though the bullish move has been and continues to be strong, it's a little unhealthy. Support has never been retested, which leaves the NASDAQ a little vulnerable if the sellers do decide to make a move.
NASDAQ COMPOSITE CHART

S&P 500 COMMENTARY
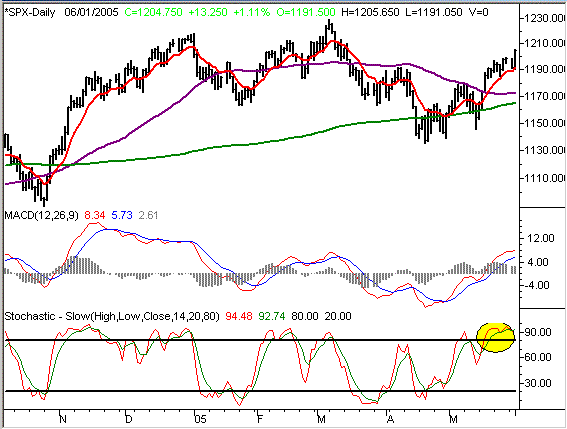
Unlike the NASDAQ, the S&P 500's chart looks a little more healthy, in that support has been seen at the 10 day moving average line (red). The SPX bounced off if it today when it hit it just above 1191. So, these large caps aren't quite as vulnerable as the NASDAQ's stocks are. The flipside is that these stocks haven't provided the same explosive growth that the NASDAQ stocks have.
On the other hand, the S&P 500 has a bullish characteristic that the NASDAQ doesn't - it's only 25 points (2.0 percent) away form reaching a new 52-week high. The NASDAQ, by comparison, is about 100 points (4.7 percent) away from a new 52-week high......and this is after the NASDAQ has rallied by more than 8 percent after hitting bottom in April!
That's not to imply that it's a race....because it isn't. But historically, stocks that hit new 52-week highs (in a bullish environment) tend to accelerate deeper into those uncharted waters. What are the odds of the NASDAQ being able to sustain a strong rally past its 52-week highs? Keep in mind that to even get to 2090, that would mean more than a 12 percent rally from April's lows. It's possible, but even the tech-heavy NASDAQ has its limits. The S&P 500, on the other hand, held up much better than the NASDAQ did in the tougher part of the year, leaving it better poised for this recovery. It's only up 6.0 percent from its lows, but this really may be a case where slow and steady wins the race. The big profits that the NASDAQ can boast may also invite a big wave of profit-taking. The S&P 500 doesn't have that risk (at least not yet), so this large-cap index may have more potential in front of it. Most of the NASDAQ's potential is behind it.
All the same, the recent strength should at least be a little intimidating. We're well overbought (stochastics), and buying into strength this year has been punished more often than rewarded. This rally could be the expeption by being the beginning of a long-term move. But, it's still just too soon to say that yet.
S&P 500 CHART

Price Headley is the founder and chief analyst of BigTrends.com.