The buyers are either resilient, or crazy. Following yesterday's selloff after news up a coup in Thailand, one could have justified it as the final proverbial straw that would break the back of this overbought market. But, halfway through the session, the rebuilding effort began. Although stocks still closed in the red on Tuesday, today's strength more than makes up for what was left of yesterday's loss. Maybe it's just a case where that which does not kill the market only makes it stronger.
NASDAQ Commentary
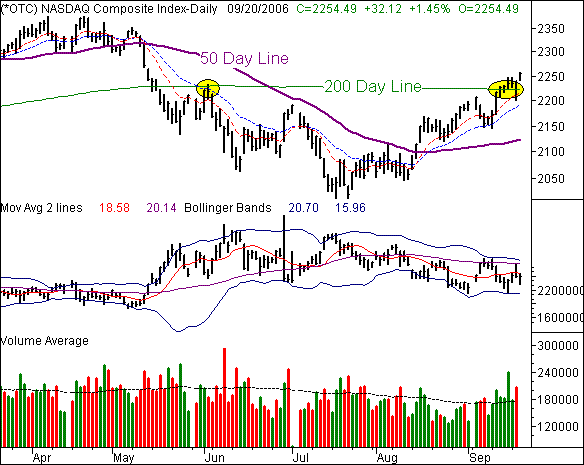
The NASDAQ Composite is leading the way today with a 1.45% gain. Up 32.12 points for the day, the current level of 2254.49 is just 18.9 points (+0.85%) above Friday's close. Obviously that puts all of this week's gain so far on the shoulders of today's rally. The question is, can today's rally carry the load through tomorrow?
The trend, needless to say, is bullish. It has been for about two months, despite a few blips, and despite the odds, especially in the latter portion of the rally. From that perspective, we have to be bullish.
The problem remains, though, what's fueling the rally, and can it last? One could argue the Fed's decision to 'leave things alone' is bullish, or that falling oil is good for every other sector. And we think both are valid arguments. The only pitfall is longevity - can recycled news push the NASDAQ even higher even though September is generally the worst month for the composite? It would be very likely, were it not for one thing, the CBOE NASDAQ Volatiltiy Index (VXN).
Yeah, we're still talking about it. But, we're talking about it because it's again too low, showing far more complacency and confidence than the current market can support. Yet for the time being, it's having little negative impact on the index.
Now that we're past the 200 day moving average (green) at 2222, we'll use that as our primary support line. The 10- and 20-day lines at 2210 and 2187 (respectively) could also be support. The next resistance level is 2375, where the composite topped earlier in the year. Although the odds, and the VXN, favor a good-sized pullback, the path of least resistance is now to the upside.
NASDAQ Chart

S&P 500 Commentary
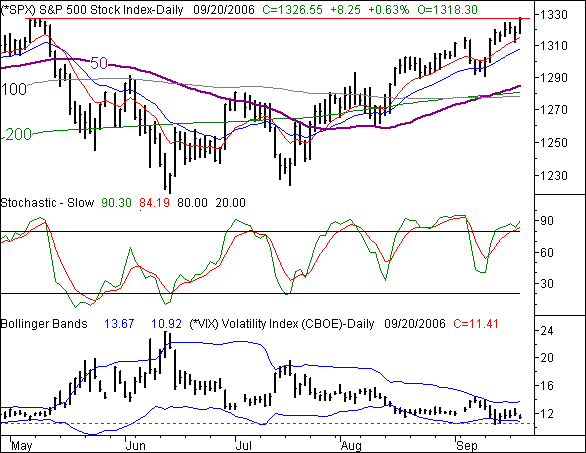
The S&P 500 is now officially the first to re-reach its highs for the year. Today's brush with 1327.75 is just a hair above May's peak of 1326.70. However, it's suspiciously not gotten much past that mark either. Will today's 0.63% gain end up being a last gasp? Or, will the bulls be able to add to this week's 6.7% gain (0.51%) and finally get - and keep - the SPX in new high territory?
Although the NASDAQ's path of least resistance is a bullish one, the S&P 500 has a lot of land-mines it will need to dance around if it's ti survive this week. The biggest one is the one we already mentioned - the resistance at 1326. Yes, we're above that line now, but let's see if we're still there at the end of the day. And even if we are, we'd still need to see a few closes above 1326 to say we're able to stay here. That could take a couple of days to confirm.
The other potential hazard is the VIX; it's back to ridiculously low levels again. So far investors have shrugged it off, but we still contend that we'll have to pay the piper sometime. Factoring in how we're overbought again (stochastically), the S&P 500 looks much more vulnerable than the NASDAQ does.
There's no resistance level in place aside from 1326. As for support, the 10 and 20 day lines are still in play. Beyond that, the 50-, 100-, and 200-day lines could all act as support, they're all near 1280. If those lines happen to fail, then we're in serious trouble.
By the way, although October is generally regarded as the point when stocks start the Q4 rally, keep in mind that it usually starts with a bottom in October. That means we could sink (quickly) early in the month, especially being as overbought as we are this September, which is most likely going to end in the plus column.
S&P 500 Chart

Dow Jones Industrial Average Commentary
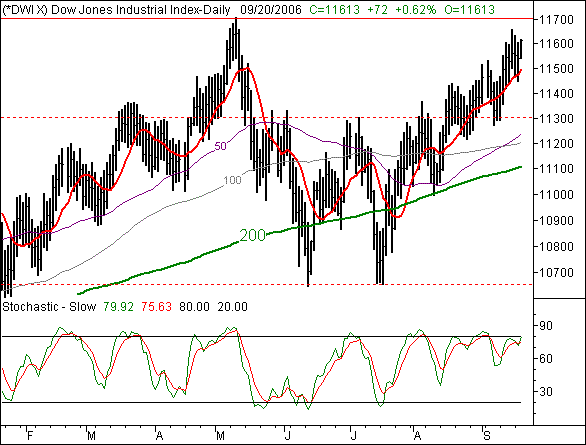
The Dow Jones Industrial Average is falling right in line with the other indices, up 0.62% (72 points) today, currently trading at 11,613. For the week, the blue-chips are up 52 points (0.45%) despite the persistent weakness in oil stocks.
Dow Jones Industrial Average Chart

Price Headley is the founder and chief analyst of BigTrends.com.