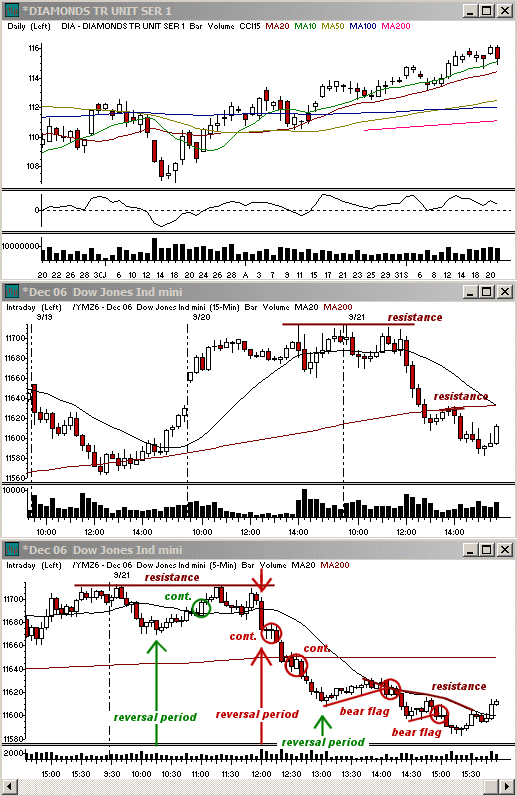
Good day! The market held up well throughout the morning on Thursday, moving higher into the session and then pulling back to the lower end of the 15 minute range until the 10:15 ET reversal period hit. There wasn't any strong volume at that point, which is normal on moves within a range, but can make it easier for a breakdown pattern to form. The market held the support very well, however, moving back to the highs of the range in three short waves of buying. It hit around 11:15 ET. This back and forth action with average to stronger than average moves is classic range action. When the 12:00 ET Philadelphia Fed came out all that changed. Selling hit hard, taking the S&P 500 and Dow Jones Ind. Ave. straight back to morning lows.
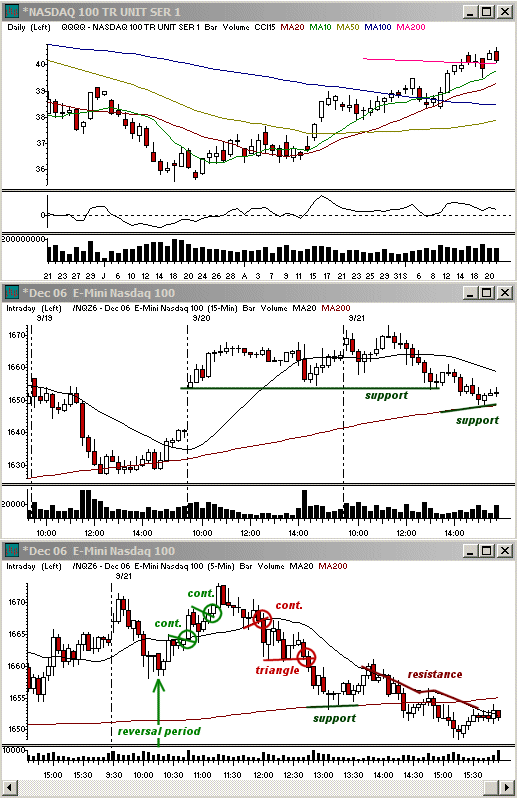
The Philadelphia Federal Reserve gave its first negative reading since 2003, indicating a decline in new manufacturing orders and shipments. After several years of steady growth, the news was unexpected. With the decisive change in pace to the downside, the market had very little chance to recover. Selling remained steady until the 13:00 ET reversal period when the indices ran into strong support on the 15 minute charts at the S&P 500's 15 minute 200 simple moving average and the closure of the prior day's gap. In the Nasdaq Composite the support that hit at the same time was Wednesday's lows.
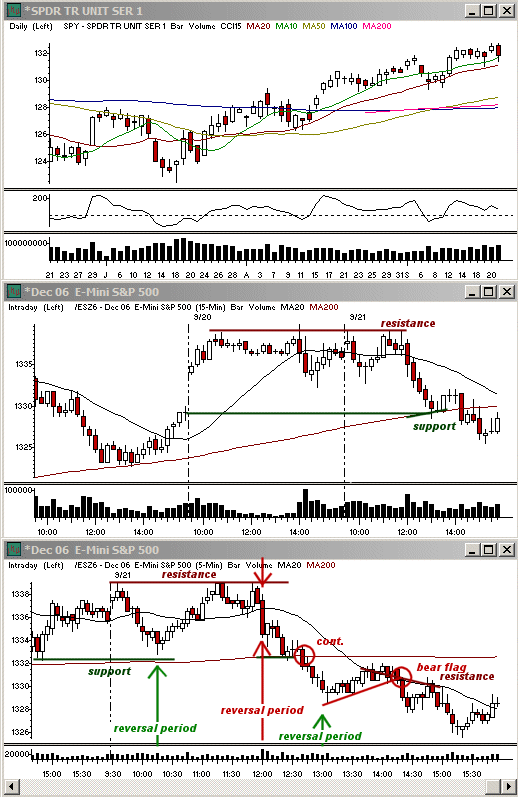
Although volume rose on the 5 minute charts, it didn't translate to a 15 minute exhaustion move. Without a strong increase in volume on that time frame, it left the door open to further selling either in the afternoon or the next morning. The sharp downside that was much greater than average meant that the market would have a difficult time pulling higher off the support. This left two likely scenarios. Either the indices would base along the support into the close and then break lower in the morning, or the selling would continue on a 5 minute bear flag but without the same momentum. I was hoping to see the former since it would have created a larger and stronger follow though move. Instead, however, the latter took place. After hitting resistance at the 5 minute 20 sma, the market rounded off on the 1 minute charts and broke lower again, quickly retesting the prior lows and making a slightly lower low.
If this second test of lows had been more gradual than the first, it would have created a reversal pattern known as a 2B where the slightly lower low creates a trap pattern. This opens the door for a stronger bounce off the support. Since it was actually stronger than the move into 13:00, it made it more likely that the Nasdaq would test its 15 minute 200 sma, which was just under the lows and serving as a magnet. It hit at about 15:15 ET and held perfectly for the remainder of the day.
The breakdown on Thursday afternoon left the market somewhat extended on the downside heading into Friday. This will make congestion with a slight upside bias into the morning easier. The cumulative result of the sharp decline on the 19th and then again on Thursday, however, will create a great deal of difficulty for the bulls. This interplay leaves me favoring more of a range-bound type of day with higher risk for new swingtrade setups.
Economic Reports and Events
Sept. 22: -
Sept. 25: Existing Home Sales for Aug. (10:00 am)
Sept. 26: Consumer Confidence for Sep. (10:00 am)
Sept. 27: Durable Orders for Aug. (8:30 am), New Home Sales for Aug. (10:00 am), Crude Inventories 9/22 (10:30 am)
Sept. 28: Chain Deflator-Final. Q2 and GDP-Final. Q2 (8:30 am), Initial Claims 9/23 (8:30 am), Aug. Help-Wanted Index (10:00 am)
Sept. 29: Personal Income and Personal Spending for Aug. (8:30 am), Sept. Michigan Sentiment-Rev. (9:50 am), Sept. Chicago PMI (10:00 am)
Earnings Announcements of Interest
Only stocks with an average daily volume of 500K+ are listed. List may not be complete so be sure to always check your stock's earnings date before holding a position overnight.
Sept. 22: -
Sept. 25: JLG, WAG
Sept. 26: DBRN, FUL, JBL, LEN, PAYX, RHAT, WOR
Sept. 27: MKC
Sept. 28: ACN, FDO, RIMM, TXI, TIBX
Sept. 29: GPN
Note: All economic numbers and earnings reports are in lines with those compiled by Yahoo Finance. Occasionally changes will occur that are made after the posting of this column.
Toni Hansen is President and Co-founder of the Bastiat Group, Inc., and runs the popular Trading From Main Street. She can be reached at Toni@tradingfrommainstreet.com.


 Free Festival of Traders Videos