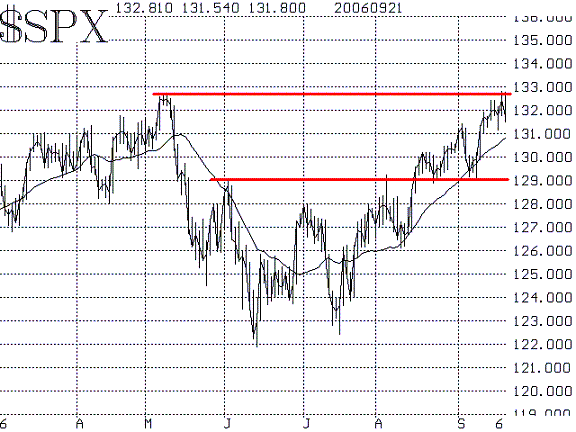
This week $SPX rallied up to its yearly highs, at 1325. That's where it topped out in May, setting of a rather sharp decline of over 100 $SPX points in about six weeks. Some traders feel we're about to repeat that, while others think it's only a short matter of time before $SPX breaks out to new highs on the upside. So there is a divergence of opinion. Let's see if the technical indicators can help clear things up.
$SPX has support at 1290, as we've mentioned before. So our feeling is that, even if it stalls out here near the May highs, it would only retrace to about the 1290 level -- thereby staying within the trading range shown on the chart in Figure 1. Thursday's decline from the 1325 level might be the beginning of such a decline. One easy guideline would be"if $SPX falls below Thursday's lows at 1315, then a near-term correction towards 1290 is likely. Eventually, if 1290 gives way, then one would have to turn outright bearish.

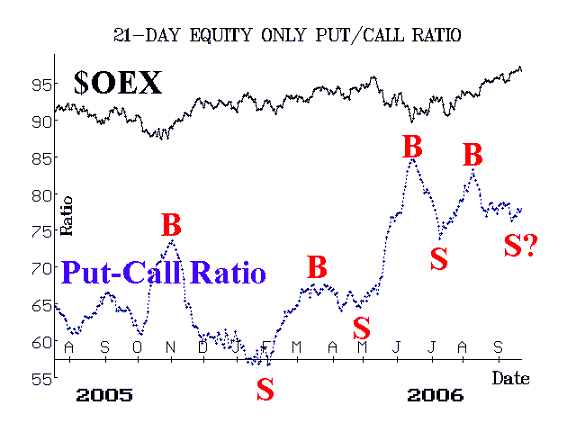
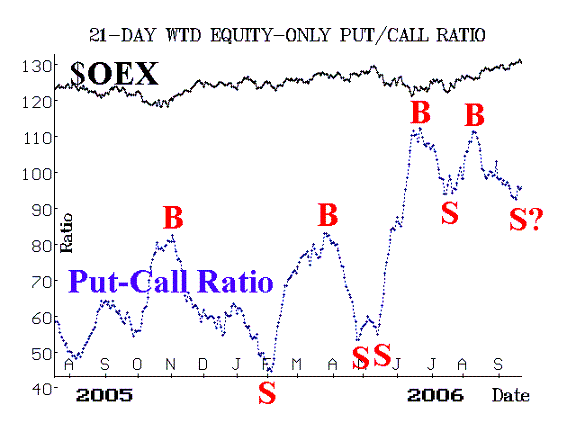
The equity-only put-call ratios remain at fairly high levels, but are looking like they're about to roll back over to sell signals again. You can see from Figures 2 and 3 that both ratios have curled upwards this week. Despite what looks like clear visual evidence of sell signals from these ratios (a sell signal occurs when they bottom and begin to rise), our computer analyses have not yet confirmed those sell signals. However, unless they begin to turn back down immediately, confirmed sell signals can't be more than a day or two away.


The two remaining indicators were the ones that were giving us some concern last week, when they were overbought, and they remain in that state. The first is market breadth (advances minus declines). "Stocks only" breadth is faring worse than NYSE-based breadth this week because of the strong rally in bonds. So the NYSE oscillator remains overbought, and has not given a sell signal as of this date. However, the "stocks only" oscillator has given a sell signal.

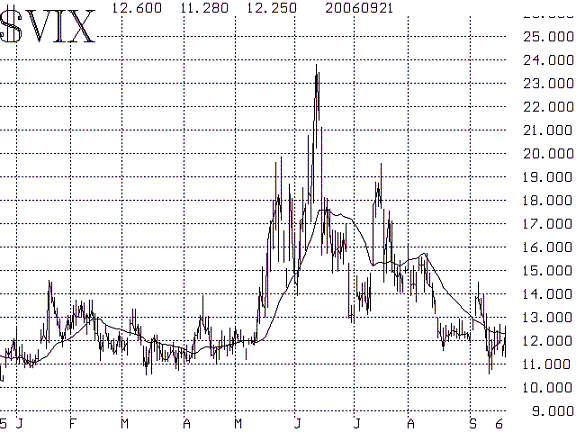
Finally, there are the volatility indices. Even when the market declined on Thursday, $VIX didn't increase much -- about a point or so. If $VIX were to close above 12.70, that would be the first step towards a minor sell signal, and if it closed above 14 that would be a full-fledged sell signal.
In summary, the indicators are slowly turning more bearish: $SPX has fallen back from resistance at 1325, the put-call ratios are edging upwards, and there is a sell signal from "stocks only" breadth. But none of these is definitive. We'd only turn bearish if the other things fell in place: $SPX closing below 1315, confirmed put-call ratio sell signals, and $VIX closing above 12.70, at least.
Lawrence G. McMillan is the author of two best selling books on options, including Options as a Strategic Investment, recognized as essential resources for any serious option trader's library.