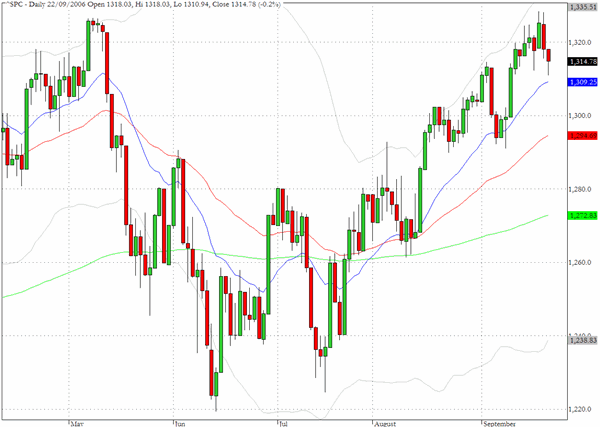
Following Thursday's data from the Federal Reserve branch in Philadelphia revealing a more marked slowing in economic activity than expected, the indices continued on Friday to retreat from their recent strength. Just how seriously the data should be regarded by equity traders will become clearer as further economic reports are released but the markets appear very resilient at present. Fund managers took the geopolitical events last week in Thailand and Hungary in their stride and the significant drop in energy prices seems to be diverting attention away from the growing evidence of weakness in the housing market.
The possibility of pre-emptive earnings warnings could unsettle the markets as we move into October but as long as support around 1300 holds we may see new multi year highs in what remains of the third quarter.
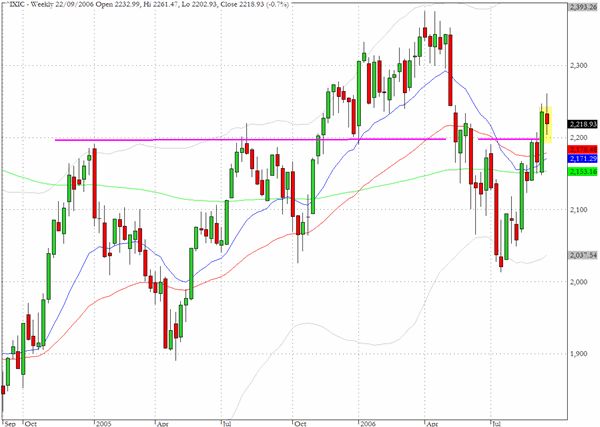
The weekly chart of the Nasdaq composite (^IXIC) highlights how 2180-2200 is a key level for the index. Friday's close at 2218 preserves the recent positive chart action and as long as the index can remain above 2180 there remains the possibility of a retest of the early 2006 highs. The small caps are faring less well and the Russell 2000 needs a close above 740 to look as though it could take on the all time highs registered earlier this year.
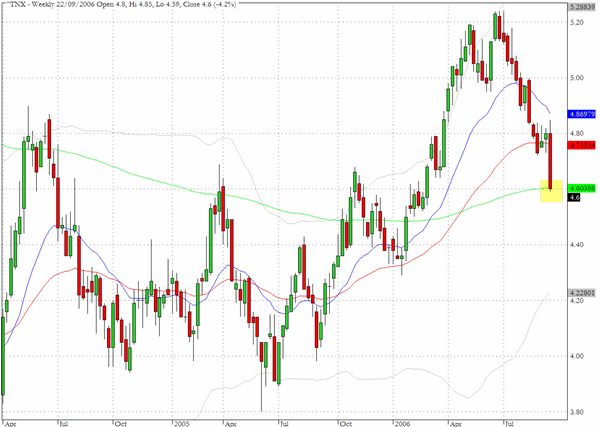
The weekly chart showing yields on the ten year Treasury note point to the 4.6% level, where yields finished on Friday, coinciding exactly with the 200-day EMA. As we pointed out last week the precipitous decline since late June has brought yields back to levels not seen since short term rates were considerably lower than they are now. Last week alone the yield declined by twenty basis points suggesting that Treasury traders are beginning to factor in Fed easing in coming months.
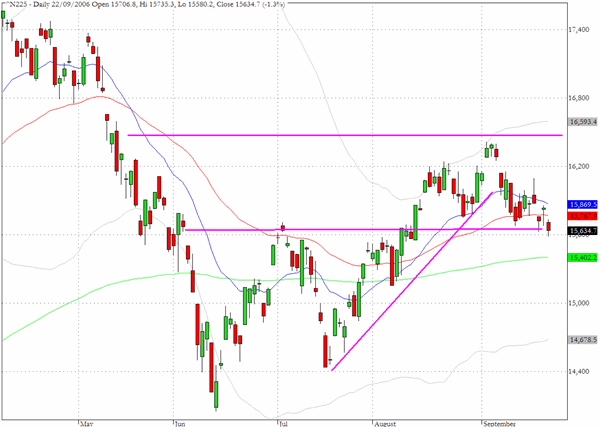
The Nikkei 225 has been trading within a channel of one thousand points between 15600 and 16600 during the last six weeks and is now testing the bottom of the range. A recent upward trendline was violated and the 200 day EMA at 15400 could provide an important test of support in coming sessions.
TRADE OPPORTUNITIES/SETUPS FOR MONDAY SEPTEMBER 25, 2006
The patterns identified below should be considered as indicative of eventual price direction in forthcoming trading sessions. None of these setups should be seen as specifically opportune for the current trading session.
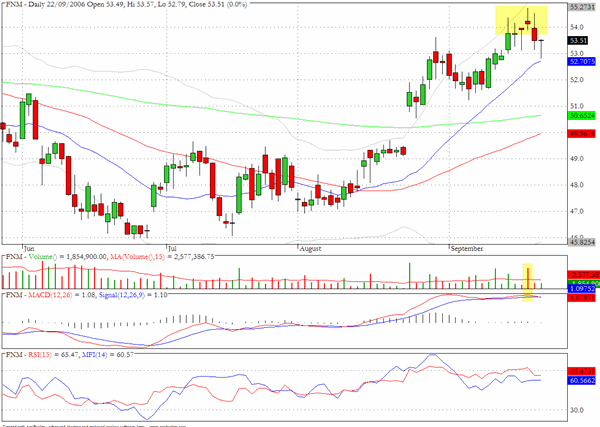
Fannie Mae (FNM) has registered several long upper tails recently as it has tried to penetrate the $54 level.
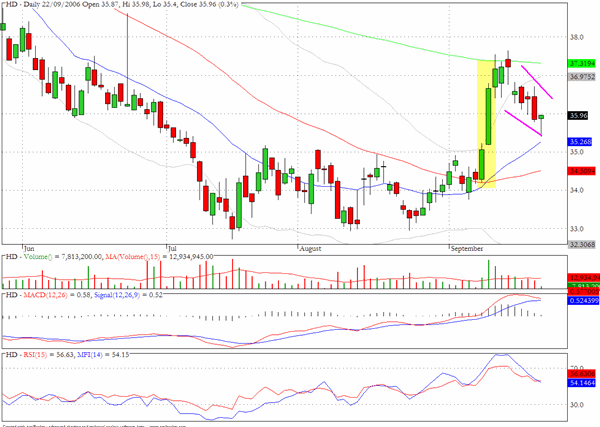
Home Depot (HD) may find renewed interest on the long side as it approaches $35.
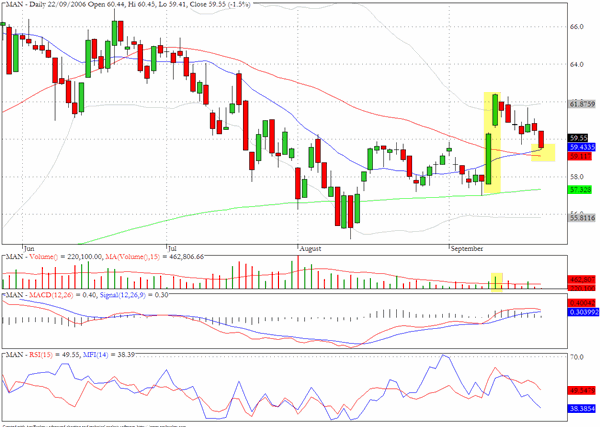
Manpower (MAN) has pulled back towards the intersection of the 20- and 50-day EMA's after experiencing an upward surge earlier in September.
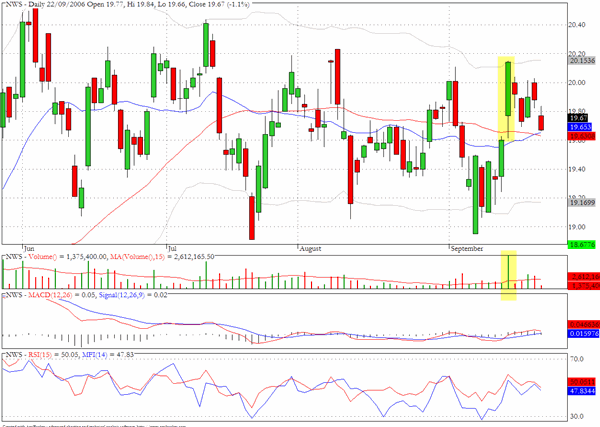
News Corporation (NWS) also has pulled back to the intersection of the 20- and 50-day EMA's and could find resumed buying interest.
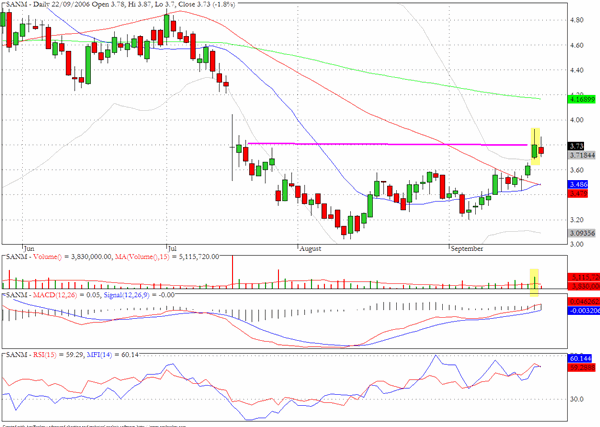
We mentioned Sanmina (SANM) on the long side in Thursday's commentary, and it produced a nice one day return of almost five percent. On Friday a corrective inside day was registered but we would be looking to get long again as the stock heads back towards the 50-day EMA just above $3.60.
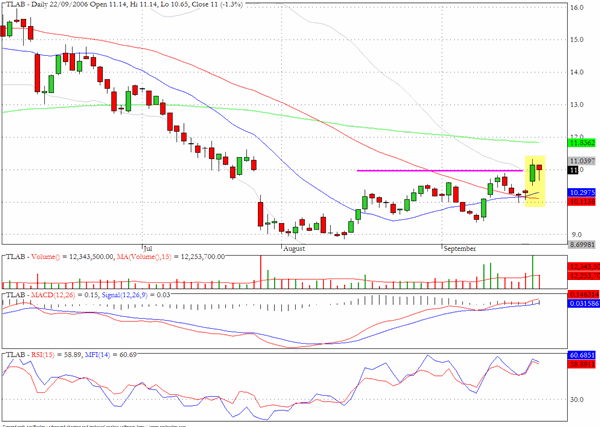
Tellabs (TLAB) produced a potential breakout pattern on Thursday on heavy volume and as with Sanmina we would suggest a long position on further pullbacks towards $10.25.
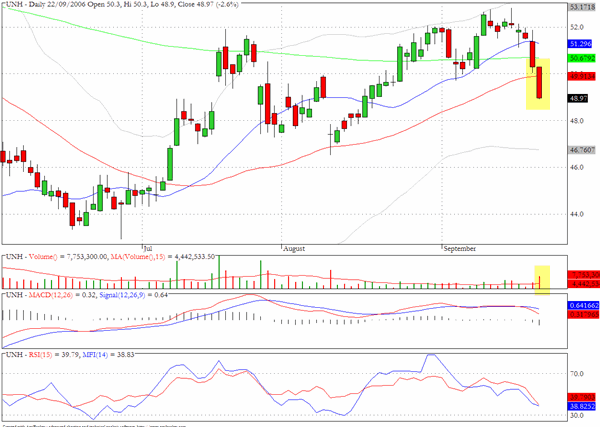
United Health Group (UNH) has dropped below all three moving averages over the last two sessions. Chart support at $48 may provide relief from the selling that picked up momentum on Friday but longer term the chart should be monitored for opportunities to get short.
Clive Corcoran is the publisher of TradeWithForm.com, which provides daily analysis and commentary on the US stock market. He specializes in market neutral investing and and is currently working on a book about the benefits of trading with long/short strategies, which is scheduled for publication later this year.
Disclaimer
The purpose of this article is to offer you the chance to review the trading methodology, risk reduction strategies and portfolio construction techniques described at tradewithform.com. There is no guarantee that the trading strategies advocated will be profitable. Moreover, there is a risk that following these strategies will lead to loss of capital. Past results are no guarante of future results. Trading stocks and CFD's can yield large rewards, but also has large potential risks. Trading with leverage can be especially risky. You should be fully aware of the risks of trading in the capital markets. You are strongly advised not to trade with capital.