NASDAQ Commentary
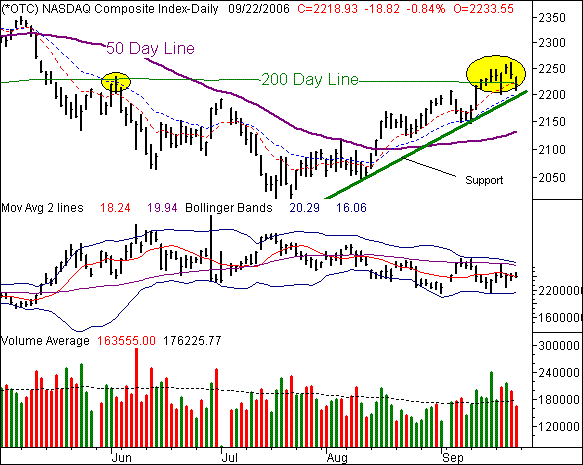
The NASDAQ's 18.82 dip on Friday (-0.84%) left it at 2,218.93. The weekly close was 16.66 points under (-0.75%) the prior week's close. Obviously Friday's demise was the only reason for the negative close for the week, but that only applies to the NASDAQ - the other indices were in the red by Thursday. In any case, it doesn't bode well for stocks, although we've seen this fake-out before.
In the interest of fair play, we do need to present both sides of the story. What's bullish? Well, mostly what's not exactly bearish. Despite the pullback, the NASDAQ remains above the 20-day moving average (blue, dashed) as well as a longer-term support line (green, not the 200-day line). In fact, the support line and 20-day average have been working in tandem - and each time they've been tested, the bulls won the battle. Clearly last week's slide didn't break the streak, so the bulls still have a chance here.
What's bearish? Surprisingly, not a lot. The momentum is, technically, but a 0.75% dip over the course of the week isn't a severe blow. One could also make an argument that the volume tide had turned, and it has. However, that too is still a little questionable. We've seen moderate volume behind the three down days last week, but no deal-breakers.
The only real bearish worry is still the VXN, and only because it's just too low. However, it's been 'oo low for a while, yet still hasn't actually presented a problem. However, the complacency will have to be bled off sooner or later. It's just that there's nothing yet (really) that says now is the time. Keep an eye on the 20-day moving average line and that support level. They will be the red flag.
NASDAQ Chart

S&P 500 Commentary
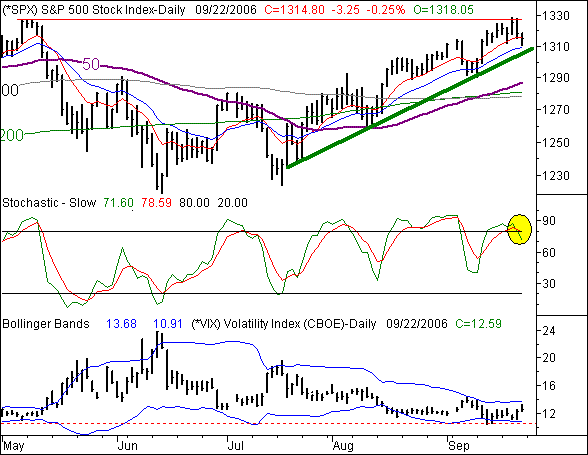
Losing 3.25 (-0.25%) on Friday, the S&P 500 closed at 1,314.78. That led to a 5.05 slide (-0.38%) for the week, and resulted in the first close under the 10-day moving average since September 11th. You may recall on Wednesday we were discussing the tightrope the SPX would be walking. All of those ideas still apply. However, there's still a note-worthy bullish catalyst in view.
The S&P's story is actually pretty similar to the NASDAQ's, with one small twist. Like the NASDAQ, last week's pullback still didn't drag the index under its long-term support line (the green line that isn't the 200-day average). In fact, the 20-day line still hasn't even been testes as support either. Translation? In terms of chart-watching, the uptrend that began back in July is still intact.
However as we said, there's a twist to the S&P 500's bearish characteristics. First, note that we actually got an official stochastic sell signal on Friday, when both the %K and %D lines fell back under the 80 'overbought' threshold. Plus, look at the VIX (again). It's still amazingly low, and keeps the market amazingly vulnerable. While we thought the hover around the mid-12 area in August was going to be a problem, the recent (and sustained) visit around the 10 level is just plain scary. So far investors haven't been penalized for their arrogance, but when it finally happens, look for a VIX spike to coincide with a big correction.
The twist is just the fact that the index literally turned tail the very next day after hitting (barely) new highs for the year. It leads us to believe some big players were just waiting to see the milestone reached just so they could hit the sell button, and leaving the unsuspecting masses without a parachute. After all, they were all 'buying on new highs' as they've been mindlessly instructed to do. Maybe the market will indeed move higher, making the 'buy new highs' theory the correct one. It's just very interesting how precise the reversal point was with the year's prior high. It just looks like a little manipulation; that's all.
In any case, be watchful early this week. We expect to see a break - one way or the other - soon.
S&P 500 Chart

Dow Jones Industrial Average Commentary
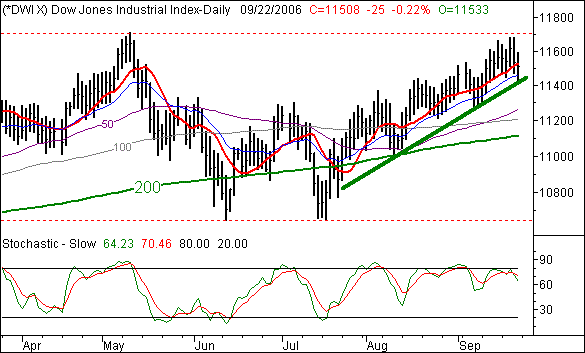
The Dow Jones Industrials gave up 25.13 points (-0.22%) on the last day of the week, closing at 11,508.10. That was 53 points below (-0.46%) the previous Friday's close. However, much like the S&P 500 (and the NASDAQ for that matter), we don't want to react too quickly to one bad week. After all, it's been give and take for the last two months...this week may have just been a take.
With that in mind, the Dow is also at a crossroads - above support, but suspiciously just shy of new highs for the year. Be patient. A move past 11,709 is bullish, while a break under the support line at 11,420 would be bearish.
Dow Jones Industrial Average Chart

Price Headley is the founder and chief analyst of BigTrends.com.