Although it's been nearly two months since we last took a look at the financial sector, our take hasn't changed at all - these stocks are still walking higher, and present an interesting opportunity. By 'walking higher', we simply mean these stocks haven't been over-extended to the point where a big correction was imminent. Instead, the financial sector has been the slow-and-steady tortoise...the kind that won the race in the end. As proof, consider this...although the Dow Jones Financials Index has never been the best performing sector in any of the timeframes we watch (from five days to one year), since the beginning of the year, it has never been in the bottom half of those rankings. Today we'll take a detailed look at the sector, and then drill-down into its individual industries.
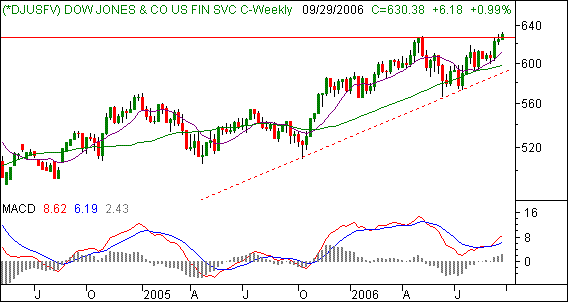
We're going to be looking at the Dow Jones Financial Services Index (DJUSFV) for our analysis. The summer wasn't necessarily kind to the financial sector (nor any sector, for that matter). However, our weekly chart also shows pretty good support around the 200 day moving average line (green), and more recently, shows us support around the 50 day line (purple). The result is a new bullish MACD crossover accompanied by the move into new high territory. The index has historically done well with this set up, and based on the tendency to repeat history, we expect to see the same again. Out upside target is 700, with a stop on the bullish bias coming with any close under the 200 day line, which is currently at 600.
Dow Jones Financial Services Index (DJUSFV) - Weekly

As for what's specifically driving (or not driving) the financial sector, we'll break the index down into its major component industries...banking, brokerage, insurance, and lending (which includes a heavy dose of mortgage lending, and therefore, real estate influence). Two of the industries appear pretty promising, while the other two seem a little problematic.
Note that for all of these charts, the purple line is the 50 day moving average, and the green line is the 200 day moving average.
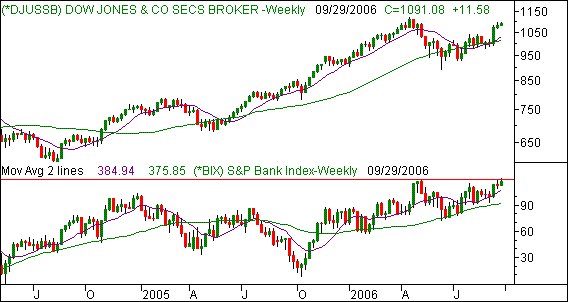
The two mostly-bullish indices are the S&P 500 Banking Index (BIX) and the Dow Jones Securities Brokers Index (DJUSSB). The brokerage stocks pushed off of their 200 day moving average line three weeks ago, and have given investors a little follow through. However, once these stocks get going, they tend to do very well for a while. Just look back to 2005 for an example. Banking stocks are also using the 200 day line as support, although not nearly as explosively as the brokerage stocks are. The banks are grinding it out pretty slowly, but if they can actually get past resistance from the previous high of 392, they could perk up a little.
Dow Jones Securities Brokers Index (DJUSSB), S&P 500 Banking Index (BIX) - Weekly

The other two indices worth a look are the Dow Jones Full-Line Insurance Index (DJUSIF) and the Dow Jones Mortgage Finance Index (USMF.X). Both are actually in an uptrend, but both of them also look a lot more apt to roll over than to continue upward.
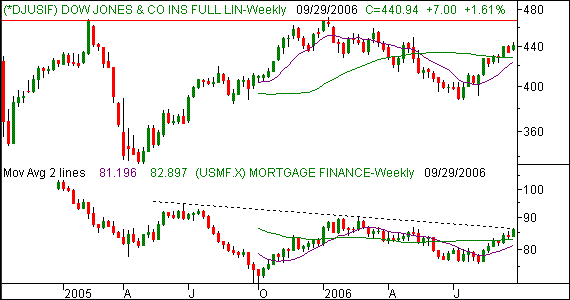
The insurers are collectively above the 200-day average. But, the pace of the gains that got them there has slowed tremendously, especially in the last three weeks. The same can be said about the mortgage lenders, except the mortgage index is also contending with what appears to be a pretty strong resistance line (so far, anyway). That, coupled with ongoing fears of a slow-down in the housing market, don't bode well for this industry's stocks.
Dow Jones Full-Line Insurance Index (DJUSIF), Dow Jones Mortgage Finance Index (USMF.X) - Weekly

Price Headley is the founder and chief analyst of BigTrends.com.