NASDAQ COMMENTARY
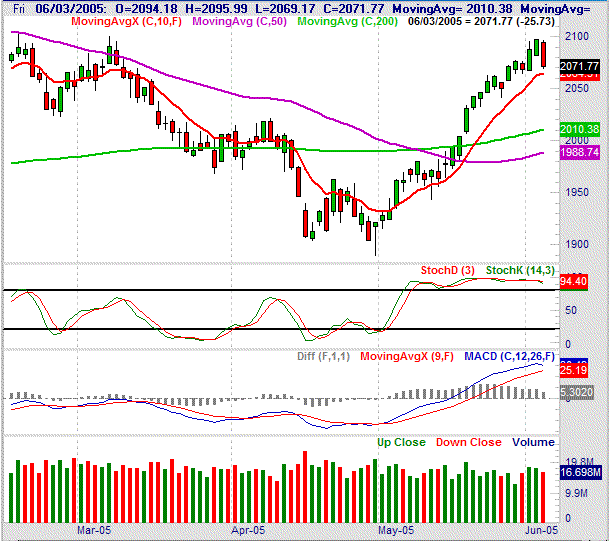
On Friday, the vulnerability created by a strong, untested runup was finally realized. The NASDAQ Composite lost almost 26 points (-1.2 percent) to end the week at 2071.77. For the week, the index lost 4 points. It may seem minimal, but after four straight weeks of gains, this dip is no small matter - it may well represent the beginning of the first real correction of this new bull trend. Incredible, though, is the fact that the NASDAQ still hasn't fallen under its 10 day moving average (red). This is one of the key short-term indicator lines, so even after Friday's bearish day, the uptrend is still intact.....technically.
What we're more interested in right now is not so much the momentum of the change in the day-to-day closing prices, but the shape of the daily bars themselves. Take a close look at the last three bars worth of trading. These 'candlestick' charts got their name because the bars appear to have wicks (at both ends). But over the last three sessions, the wicks have either been shrinking, or non-existent; we're opening and closing right at the highs and lows for the day. If it were just one bar like that, it wouldn't be a big deal, but the last two bars (in relation to each other) are particularly telling. On Thursday we opened at the low and closed at the high, and then on Friday we opened basically at the high (and under Thursday's high), then proceeded to close near the low.....and under Thursday's low. This sequence of bars suggests that the bulls may have finally exhausted themselves, and Thursday was their last gasp. On Friday, there were no buyers left, and the bulls finally stepped in and took control. If that is indeed the case, it will be come evident early in the coming week.
Now, candlestick patterns alone are not the end-all, be-all indication of a transition from one trend to another. We're also looking for a little more downside due to the extreme readings we're seeing in other tools. Stochastically, we're well overbought.....and have been for a while. But after Friday, we're on the verge of an important stochastic sell signal - a cross under the 80 line. The MACD lines are also discouraging, in that the faster MACD line (blue) is pointing lower for the first time in weeks. However, in both cases, neither bear signal has been completed.
So as bearish as charts appear they could become in a very short time, the fact of the matter is that they haven't yet. So, we remain neutral until one of two things happen. The first possibility - and the one we think is less likely - is a sharp recovery in the coming week, and a resumption of the bullishness we've seen since April. The thing is, the volume behind that bullishness has never been extraordinary, so tat will be tough to do, especially with all those profits that could be bagged now. The second scenario - the one we think is more likely - is a continuation of this weakness. Odds are that we'll cross under the 10 day line on the same day we finally complete the MACD and stochastic sell signal, so there shouldn't be a shortage of bearish signs if and when it happens.
NASDAQ CHART

S&P 500 COMMENTARY
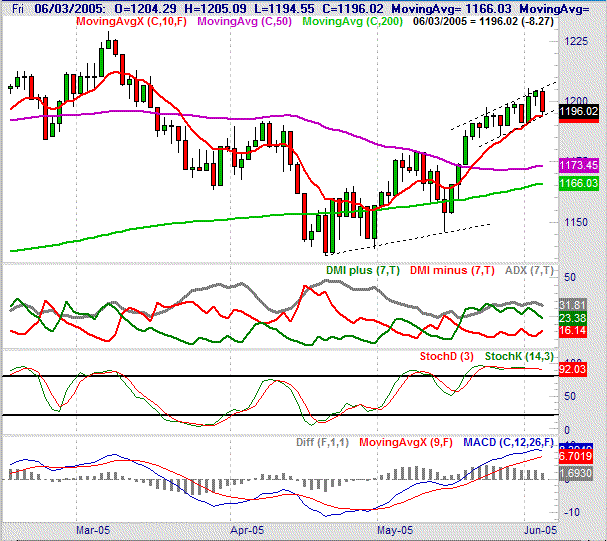
With the S&P 500 not experiencing the same bullish run the NASDAQ had over the prior four weeks, the vulnerability here wasn't as great. So, the dip isn't going to be quite a big here. However, the basic premise is till the same - Friday's big turnaround may be a sign of things to come. We remain cautious.
Unlike the NASDAQ, the SPX actually tested and found support at the 10 day moving average. This is important, although it's still way too early to say the 10 day line is going to be the rebound point. The S&P 500 closed just above it on Friday, after touching it briefly with Friday's low of 1194.55. Friday's low also helped define a secondary support line (dashed). So overall, the S&P is staying afloat despite the selloff on Friday, and the fact that it too is very overbought. On the top side of the SPX's bars we can also see a resistance line (dashed). Although the S&P 500 has been stuck in this narrow zone for the last two weeks, the fact that it's pointed upward still means that this bull trend is also still intact....technically.
Like the NASDAQ, we remain skeptical of the market's ability to keep moving higher, but we don't yet have any of the technical sell signals that a disciplined trader needs to see before going bearish. We're only on the verge of a stochastic sell signal, a bearish MACD crossover, and a bearish DMI cross. Until we get those signs, we have to hold our fire. We're staying neutral until support breaks down, or the uptrend resumes on at least decent volume.
For the week, the S&P closed at 1196.02, for a 2.76 point loss (-0.2 percent).
S&P 500 CHART

READER'S QUESTIONS ANSWERED
Q: Price, I've heard about event-driven trading strategies that play the rebalancing of the major market indices. How often is the S&P 500 Index 'rebalanced', when does it happen, is there a measurable impact on companies that are added to or removed from the Index?
A: The S&P is rebalanced on an ongoing basis. There can be several per year, but they're staggered. The Standard and Poor's company determines when and if changes are to be made. The changes are announced well in advance, and there's usually a minor buzz about them.
Click here to read S&P's methodology (scroll down a little bit to find "S&P Indices Methodology").
Click here to read previous changes to the S&P.
Generally speaking, being ousted from the index is bearish, while being included is bullish. However, we've found that to be unhelpful to anyone trying to speculate around these changes. By the time you get enough of a downtrend to get kicked out of - or added to - the index, most of the big move is over. So no, the effect would be tough to trade, although not impossible.
ECONOMIC CALENDAR

Price Headley is the founder and chief analyst of BigTrends.com.