All those support lines we discussed in our most recent Weekly Market Outlook held up, and even fueled this week's gains. Yet, some of the pitfalls we were looking at are still out there. Be sure to read carefully. PLUS, we've added an extra layer of 'relative' analysis to the Dow's chart this week. Check out the extended commentary all the way at the bottom of this report.
NASDAQ Commentary
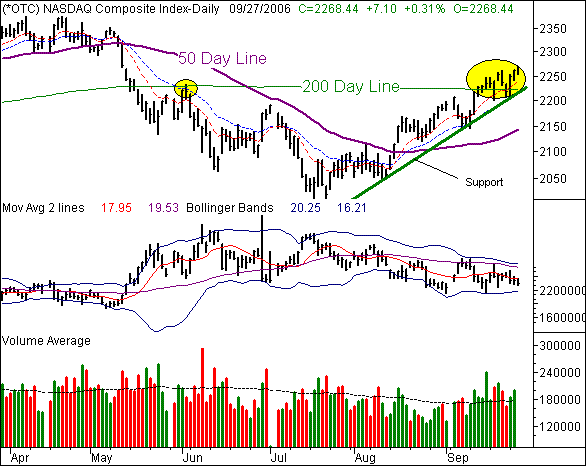
The NASDAQ Composite is up 7.1 points today, or 0.31%, For the week, it's ahead by 49.51 points (+2.23%), leaving it at its current level of 2268.44. Today's high of 2270.19 is a new five-month high. Needless to say, the support lines we were discussing in the Weekly Market Outlook were not broken, as the NASDAQ has continues upward. Volume has been very solid behind these recent gains.
Momentum? Bullish - no question. However, the same potential hazards are still in place. They are the sheer fact that we're well overbought, and more importantly, that the VXN remains at its ridiculous lows. We'll have to pay that piper sometime, but today ain't gonna' be the day.
Support is at 2228. There's no worthy resistance line at this point to discuss, although the year-high of 2375 might be coming into play relatively soon. In the meantime, the trend lines suggest more bullishness, despite our skepticism.
NASDAQ Chart

Dow Jones Industrial Average Commentary
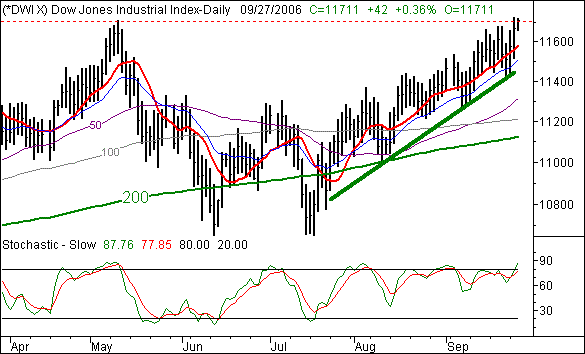
Unless you've been living in a cave until this morning, you probably already heard the Dow Jones Industrial Average hit new highs for the year yesterday. You may have also heard the blue-chip index is toying with new all-time highs. Both statements are true.
The previous high for the year was 11,709, hit on May 10. Yesterday's high was 11,724. So far today, we've only gotten back up to 11,720, which still tops the peak in early May.
Beyond that, the level to watch is 11,909. That's the peak from January of 2000, a time that many still refer to as the beginning of the end.
Of course, the bigger question is 'what does it mean?' Is this a bullish sign, based on the mentality that investors should be buying when new highs are reached? The potential pitfall is simply that the NASDAQ, then the S&P 500 should be leading the charge - not the Dow - in a true bull market. Then again, one has to keep in mind that the Dow didn't suffer nearly as much as the NASDAQ or SPX did between 2000 and 2002. So, it only stands to reason that if your road to recovery is shorter like the Dow's of course you'll be able to hit those new high marks a lot sooner than your peers. With that in mind, we took this relative look at the recent performance of all three major indices.
Year-to-Date Returns
Dow Jones Industrials: 9.3%
NASDAQ: 2.9%
S&P 500: 7.3%
Six-Month Returns
Dow Jones Industrials: 3.8%
NASDAQ: -1.9%
S&P 500: 2.8%
Point being, it's not like the Dow just happened to reach prior highs just because it had less room to go. The Dow is outperforming the other indices. That's great for the Dow stocks, but doesn't exactly scream "Bull Market!." If it were really bullish, the NASDAQ would be leading. And just for perspective, the even more salient (albeit volatile) litmus test is the Russell 2000 small-cap index. Year-to-date it's up 8.9% (2nd of the four indices). However, over the last six months, it's down 2.7% (fourth of the four). Conclusion, gains are gains, but this is hardly the raging bull market we'd all love to see. Long-term investors may want to stick with the biggest of the big-name companies. Traders, on the other hand (and as always), should still able to find pockets of opportunity in all corners of the market.
As for the Dow, the support line held up, as did the 20 day average. And, with prior resistance levels now broken, the path of least resistance remains to the upside. That said, be cautious here. The "new high" level is often where the big players sucker the little guy in. Before jumping in with both feet - and eyes closed - it may be wise to see if other investors are comfortable with taking these stocks further into new high territory. And yes, we have our doubts, although we're not married to them.
The Dow Jones Industrial Average is up 0.36% (42 points) today, currently trading at 11,711. For the week, the blue-chips are up 203 points (1.76%).
Dow Jones Industrial Average Chart

Price Headley is the founder and chief analyst of BigTrends.com.