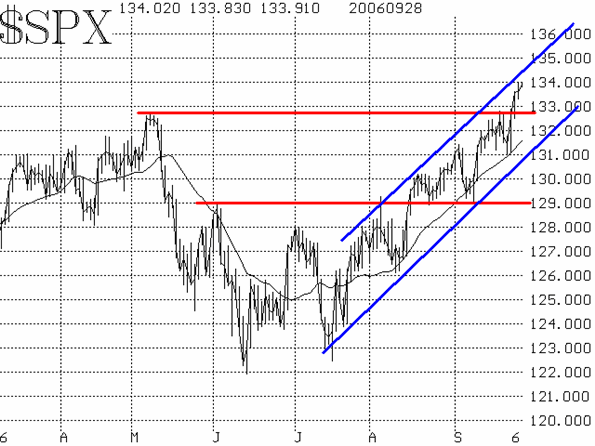
A short-term correction is overdue, but the intermediate trend remains positive. That comment is unchanged from our last report, only the levels of $SPX and the indicators have changed. $SPX broke out over 1327 this week, moving to 5-1/2 year highs. This is the index that most serious traders follow, so it is somewhat irrelevant if the Dow trades at an all-time high or not. The 1325-1327 level should now provide support for $SPX, with further support at 1290 below there. As long as $SPX holds above 1327, the bears really have no case. We consider the $SPX price chart to be an intermediate-term indicator.

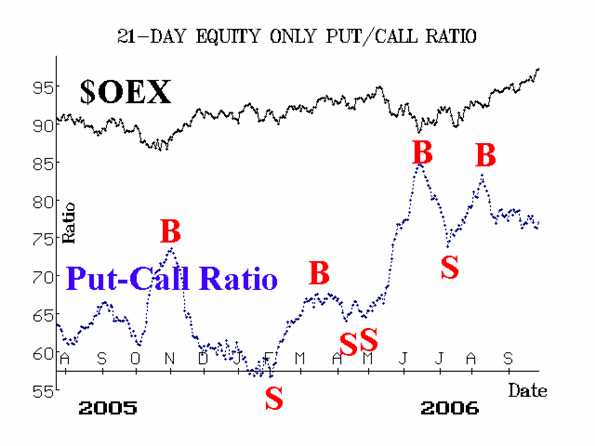
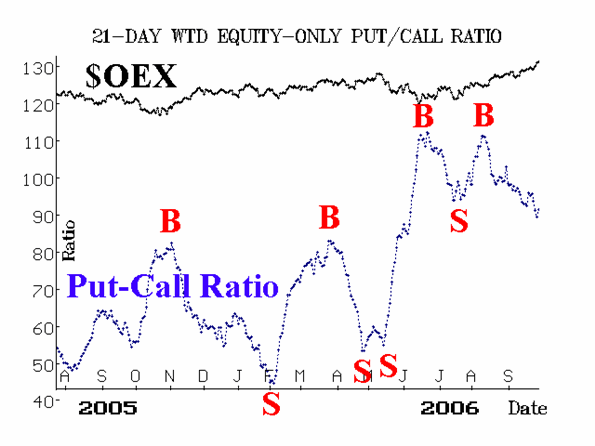
The equity-only put-call ratios remain on buy signals. The weighted ratio finally broke down below last summer's lows, which is bullish (see Figure 3). The standard ratio (Figure 2) is slowly declining, but still hasn't fallen below the July lows. These are intermediate-term bullish. From a broader perspective, these ratios are quite high on their charts and while we don't use absolute levels for determining buy and sell signals, it does indicate that the level of put trading remains extremely high. Perhaps it's just put hedging that's going on, but day after day it keeps these ratios near the top of their charts.


Market breadth has been "okay," not great. When the market declined for a couple of days last week, breadth gave sell signals, but those were quickly reversed during this week's rally. At the present time, breadth is overbought once again.

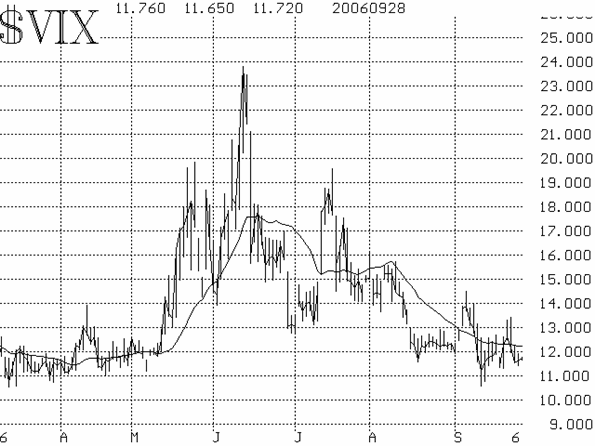
Finally, the volatility indices ($VIX and $VXO) have remained at very low levels. This is also an indication of an "overbought" market. But "overbought" does not mean "sell," and so the market can continue to advance on the basis of the bullish intermediate-term indicators, with the understanding that the overbought condition subjects the market to potentially sharp, but probably short-lived corrections.
Lawrence G. McMillan is the author of two best selling books on options, including Options as a Strategic Investment, recognized as essential resources for any serious option trader's library.