2006 has brought about some key technical signs of important changes occurring in the financial markets, to a certain extent, much like 2000 and 2002 were the pivotal years of the fairly recent past. Over the last 4 years, we have seen the markets behave in such a way that would trump long-held academic beliefs. We have seen some very real symptoms of inflationary period as prices in oil, gold and other commodities rise to new multi-decade or all-time highs. At the same time, the stock market rose in tandem, even to the point that the Dow is already right in the neighborhood of a new all-time high.
The action over the last four years has produced some incredible moments of excitement for traders in the oil and gold markets, so much that during these times, volumes of trading instruments have increased heavily to record levels. The trends to the northern territory of the charts have been consistent and clear over that time period. What can we expect going forward? This week, we will take a look at the long-term charts of gold and oil and make a simple assessment of the current situation on these markets:

Chart Notations:
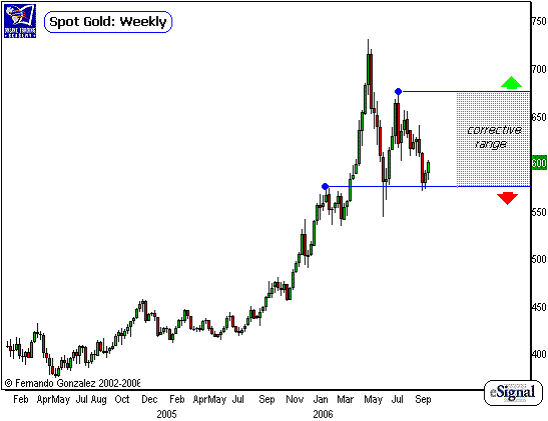
The weekly chart of the wpot price of 1oz of gold above addresses the intermediate-to-long-term time horizon.
In the time frame of the chart above, we see the price of gold nearly double, with a parabolic spike to its high at $730 occurring early in 2006. Since then, the market has entered into a corrective phase.
This corrective phase is likely to persist for several more months as the gold market consolidates for yet another attempt to shoot for its all-time high at over $800. There is plenty of momentum that the possibility of a move in Gold to an all-time high is very strong.
In this case, we will look for gold to stay contained within a corrective range of $575 to $675 over the intermediate-term, as it consolidates the parabolic move (a characteristic of the gold market) from earlier this year. Our directional bias will change outside these boundaries.

Chart Notations:
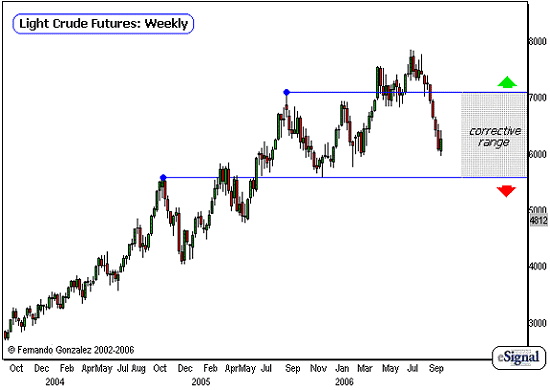
The weekly chart of the light crude futures above addresses the intermediate-term time horizon.
The uptrend over the last several years in Oil has been quite consistent, although over the last several weeks, it has experienced its fastest and most persistent decline in this time frame. This suggests a change in the character of the trend, and that an intermediate-term corrective phase is underway.
In connection to what we are seeing in the gold market, we look for the oil market to go into a corrective or consolidation phase over the intermediate-term falling within the 57 to 71 mark. Our directional bias will only change outside the boundaries.
Due to the fact that the markets we are seeing here are inflationary hubs, these consolidation phases, if in fact they will occur, suggest a stabilization in inflationary forces and further, a plateau in the direction of interest rates. While these point to a change in the character of inflationary trend, there is little or no technical evidence that suggests these trends will reverse to impulsive downward direction - yet. So long as they are contained within these simple technical boundaries (which are rather large), the uptrends appear to be intact but just entering into a flat corrective phase that precedes another round to higher levels beyond the Intermediate-term time horizon.
How will this affect the equity markets? The academic answer is that it is bullish for stocks. But stocks have been rising throughout over a dozen rounds of interest rate increases over the last 4 years, so therefore the academic answer may not be the right one. Well, to adhere strictly to the discipline of correlative technical analysis, if gold, oil and stocks have been rising together, and we are seeing signs of corrective behavior in gold and oil, then therefore we can expect corrective behavior in stocks as well. It looks to me like the sudden stock market sell-off in May is probably just a warning of a larger decline ahead, and an all-time high in the Dow is probably just a decoy. Let's see how this will all play out, as our discovery of the markets continues.
Fernando Gonzalez is in his 10th year as an active trader, technical analyst and content contributor to the active trading community and a long list of popular financial media. Online Trading Academy trading knowledge...your most valuable form of capital.