NASDAQ Commentary
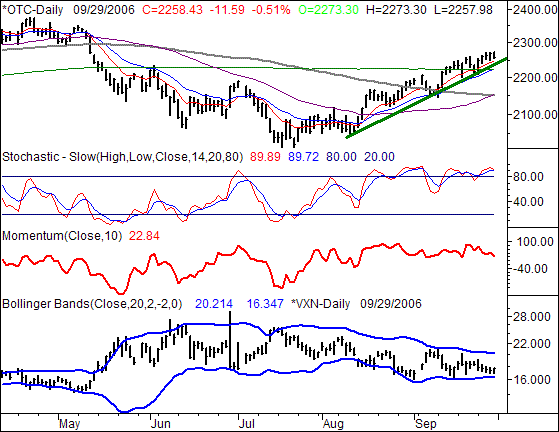
The NASDAQ's gave up 11.59 points on Friday (-0.51%) , leaving it at 2258.43 for the week. That was still 39.50 points above the prior Friday's close, however, and translated into a gain of 1.78% over the past five sessions. Have the bulls finally gotten tired yet? They're showing signs of exhaustion, but for the NASDAQ Composite, a key support line is still in place. That's going to be the key.
The up-and-down continues, with a huge Monday following a terrible end to the week before this most recent one. Each of those dips, aside from being met with an even bigger rebound, also started when a key support line was re-met. Two Fridays ago it was at 2210, and like clockwork, Monday's low of 2212 was the result of that support line holding as well, support. By Monday's close, the NASDAQ was at 2249. That, however, would be the best day of the week; the lack of progress over the next four days would actually lead to a bearish Friday.
And, that's the real story for the composite - the weakening momentum. In fact, even though the NASDAQ has managed to keep going generally higher for tow months, the momentum is just anemic. Hence, the momentum line has been flat for those same two months. Something has to give soon.
Of course, being stochastically overbought doesn't help. Traders know they've been pressing their luck, riding a vulnerable market higher foe a little too long now.
All the same, the trend is the trend until proven otherwise. The support line (broad, green) is currently at 2240, and rising. If the NASDAQ breaks under that mark, then the bearish worries will be validated. Right below there, at 2223, are the 20 day and 200 day moving averages. Both of then are note-worthy support as well. Unless they actually break, the bulls are still in business.
That being said, we still expect to see a retest of one of those levels. So from a short-term view, we're looking for some kind of dip. But, be on the lookout for a rebound at those lines too...it's possible. In the meantime, be patient about taking positions.
NASDAQ Chart

S&P 500 Commentary
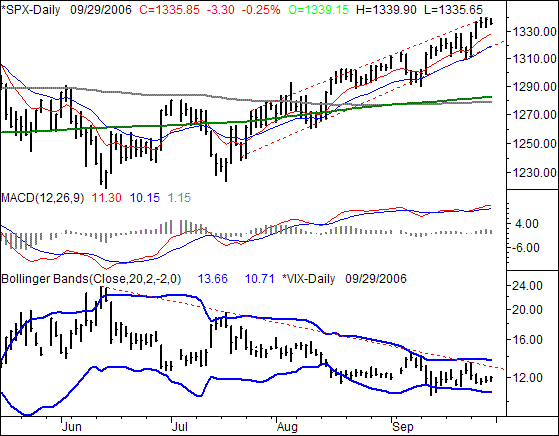
The S&P 500's 3.3 point loss on Friday (-0.25%) left the large-cap index at 1335.85. For the week, however, it's still a 21.05% gain, or 1.6%. And perhpas more importantly, the SPX hit and retained new-high levels for the year. The question is, can it follow through? In the short run, we'd say we're set for a small dip...like the onese we've seen a handful of times since the bigger recovery began in June. In the long run, though, it's still way too soon to say this is the end of the line for the bulls. After all, two steps forward and one step back has become the norm for the S&P 500...and all indices for that matter.
Once the S&P 500 hit a new year-high of 1340.10 on Wednesday, a lot of traders were inclined to think more of the same was in store. However, it was nothing but lower highs the rest of the week. Of course, that can't be a total surprise - the SPX had just run into an intermediate-term resistance line (red, dashed) that had been a reversal point a few times since July. The market was just continuing its zig-zag pattern we've grown accustomed to.
On the other side of that very zig-zag pattern is the support line (also red, dashed). It's been responsible for the past three rebounds. Currently at 1323, along with the 20 day moving average line, we really can't get too concerned for the bulls until the S&P 500 closes under that mark. After all, the large-cap index hasn't really done anything significant other than bounce around inside a generally bullish range. If that support breaks, however, then look out below...the next likely support level is the 200 day line, at 1283.
Mirroring that support line is the VIX's resistance line. We're standing pat on our argument that the VIX is still too low for comfort, yet the bulls have shrugged it off so far. The VIX has made a resistance line (red, dashed) that dates al the way back to June's peak of 23.82. It's currently at 13, and if it breaks, it could open the bearish flood gates. However, it has yet to actually happen.
The 'ideal' bear signal would be the SPX's fall under 1323 simultaneously with the VIX's cross above 13.
S&P 500 Chart

Dow Jones Industrial Average Commentary
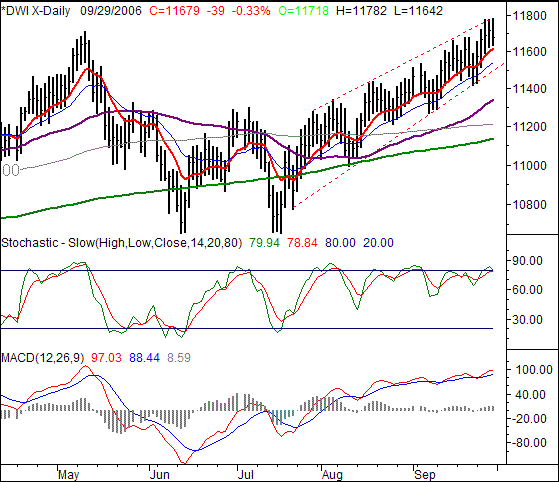
The Dow Jones Industrials lost 39 points (-0.33%) on Friday to end the week at 11,679. But, it's still a weekly gain of 171 points, or 1.49%. And don't forget, the Dow also hit new all-time highs last week, so something is at clearly at least a little bullish. On the other hand, the market's gains are becoming more of a struggle.
The story here parallels that of the NASDAQ and the S&P 500. The uptrend has been unlikely, yet has happened all the same. The result has been the definition of a generally bullish channel, in which the Dow has just been 'ranging' for the last couple of months. As of Friday, the upper boundary is at 11790, while the lower boundary is at 11510. We have no reason to think the Dow won't continue to explore the complete span of said range.
In the meantime, we'll just add that you may not want to get overly excited about the Dow's entry into new all-time high territory - it's really not the kind of big deal it used to be. Historically it was the right time to buy, but in recent years there is absolutely no empirical evidence that you should 'buy new highs'.
Dow Jones Industrial Average Chart

Bottom Line
September defied the odds by putting up some pretty good gains. And as you all know, October is the beginning of the 'best quarter of the year'. However, and perhaps even more importantly in the shadow of a pretty bullish September, it's important to keep in mind that 'Q4 rally' doesn't necessarily start on day 1. More often that not, we see a strong bottom being made in October...then the rally starts. Clearly the momentum is anything from bearish as we roll from the previous quarter to this one. But, we have to wonder of the September strength is just setting up an even bigger October bottom-making move. We are, after all, very overbought. We think the VIX - of all things - will actually spot the true top and bottom over the next few weeks. But yes, we're more than do for a significant correction.
Price Headley is the founder and chief analyst of BigTrends.com.