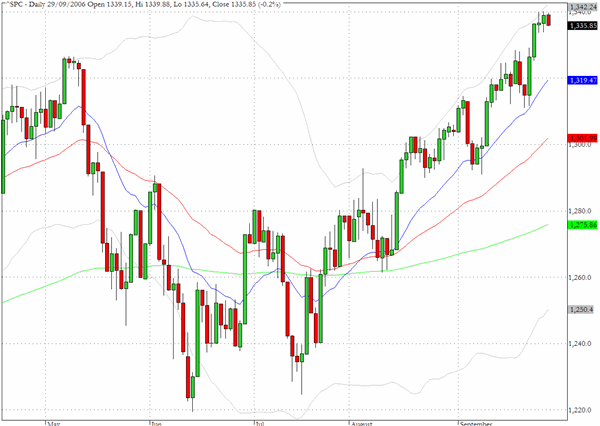
The S&P 500 (^SPC) concluded the third quarter with an inside day pattern that accompanied a modest retreat of 0.2%. For the quarter as a whole the index gained slightly more than 5% compared to a gain of 4.8% for the DJIA and slightly less than four percent for the Nasdaq Composite. By comparison as the next chart shows the small cap stocks fared less well during the quarter.
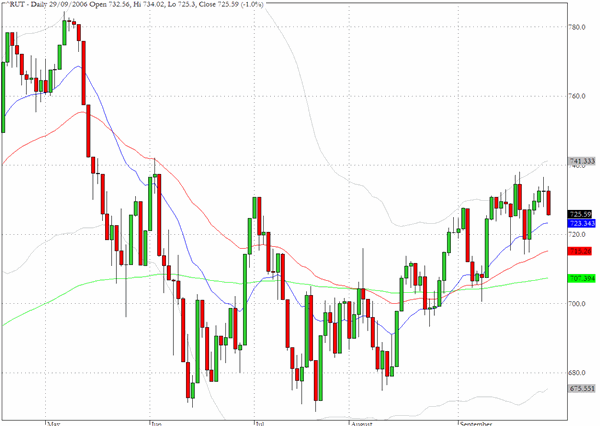
The chart for the Russell 2000 cash index (^RUT) illustrates the under-performance of the small caps during the third quarter in comparison with most of the other broad indices. The index has made virtually no progress since the beginning of July as it began the quarter at 724.67 and closed the quarter at 725.39.
The lack of movement in the smaller capitalization issues reflects the transformation in the overall complexion of the market since the May correction as the leadership and momentum have notably shifted away from the Russell 2000 towards the larger cap stocks.
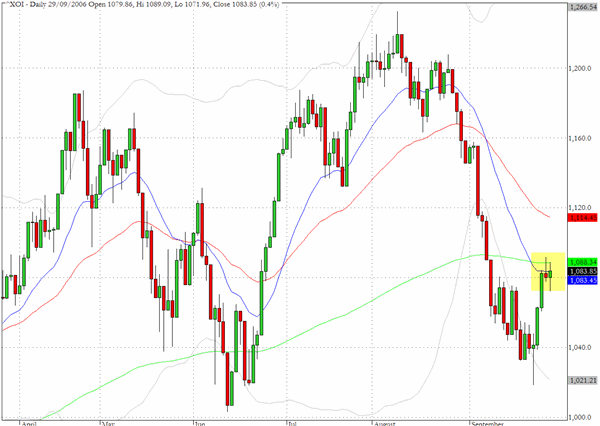
The oil index (^XOI) has rallied back to the neighborhood of the 20- and 200-day EMA√Ę‚,¨‚"Ęs and this pattern coincides with several stocks in the sector such as Marathon (MRO) and XTO. Meanwhile Exxon (XOM) and Chevron (CVX) have made back further ground and reached price levels which coincide with their respective 50-day EMA√Ę‚,¨‚"Ęs. It would not be surprising to see the index make further progress towards the 50-day EMA at 1120 but after that some sideways action and consolidation is to be expected.
TRADE OPPORTUNITIES/SETUPS FOR MONDAY OCTOBER 2, 2006
The patterns identified below should be considered as indicative of eventual price direction in forthcoming trading sessions. None of these setups should be seen as specifically opportune for the current trading session.
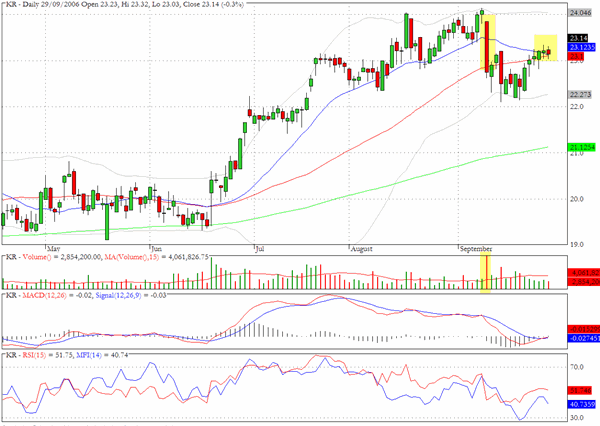
Kroger (KR) closed Friday's session at the intersection of the 20- and 50-day EMA's and the chart pattern is suggesting that the 200-day EMA could be a probable target in coming sessions.
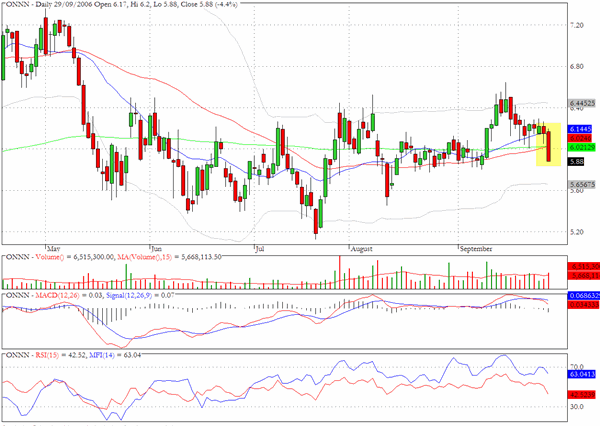
ON Semiconductor (ONNN) dropped below all three moving averages on above average volume in Friday's trading.
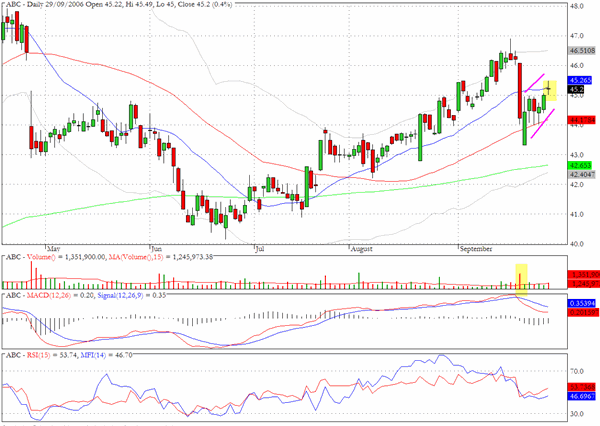
Amerisource Bergen (ABC) registered a Doji candlestick on Friday exactly at the 20-day EMA and within the context of an ascending channel/bear flag formation.
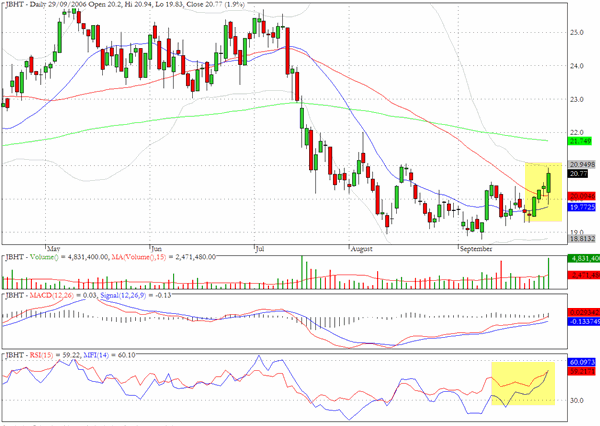
JB Hunt Transport (JBHT) looks ready to take on the chart hurdle in the vicinity of $22 and there has been noticeable accumulation in the last several sessions.
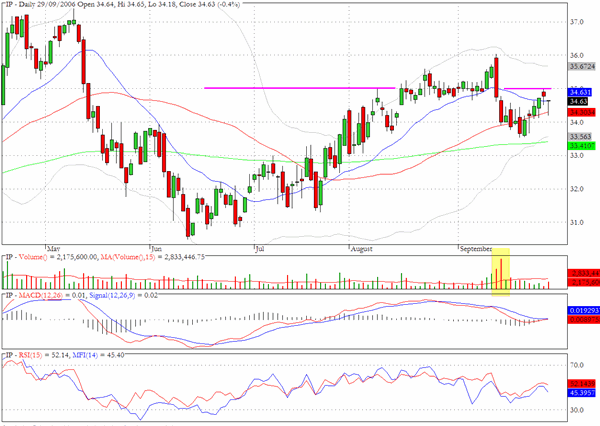
International Paper (IP) could encounter resistance at the $35 level
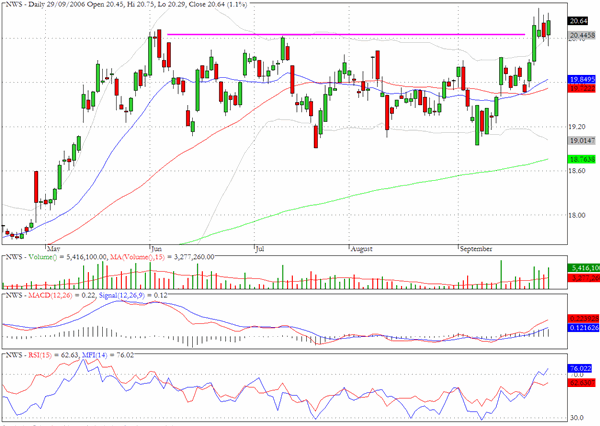
News Corporation (NWS) was mentioned here a week ago and as we noted later in the week there could be further to go following the breakout pattern.
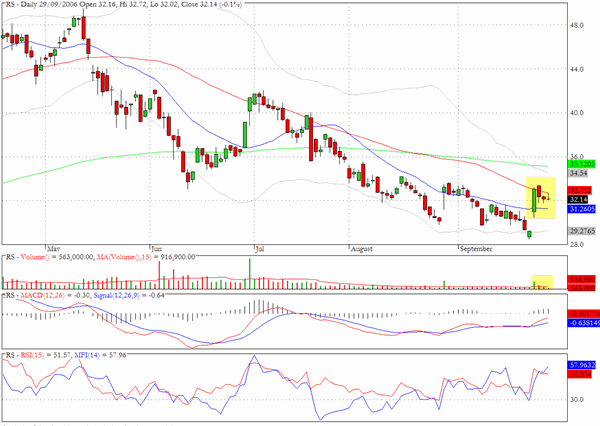
Reliance Steel (RS) could be in the early stages of a bull flag formation following the gap upwards on heavy volume earlier last week.
Clive Corcoran is the publisher of TradeWithForm.com, which provides daily analysis and commentary on the US stock market. He specializes in market neutral investing and and is currently working on a book about the benefits of trading with long/short strategies, which is scheduled for publication later this year.
Disclaimer
The purpose of this article is to offer you the chance to review the trading methodology, risk reduction strategies and portfolio construction techniques described at tradewithform.com. There is no guarantee that the trading strategies advocated will be profitable. Moreover, there is a risk that following these strategies will lead to loss of capital. Past results are no guarante of future results. Trading stocks and CFD's can yield large rewards, but also has large potential risks. Trading with leverage can be especially risky. You should be fully aware of the risks of trading in the capital markets. You are strongly advised not to trade with capital.