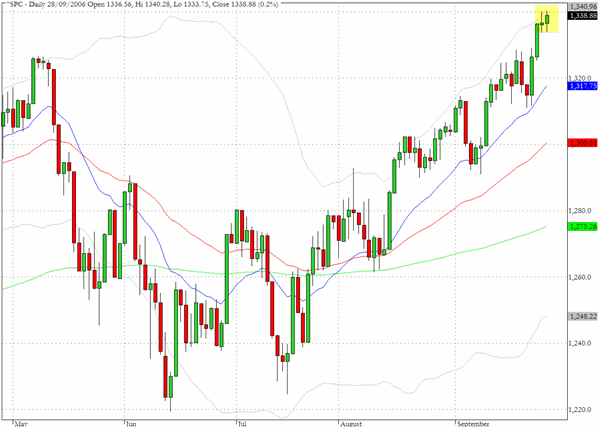
The S&P 500 pushed further into multi-year high territory yesterday with a 0.2% gain to close at 1338 which coincides with the top of the 50-day volatility bands. Third quarter trading concludes today and fund managers will be keen to preserve the strong gains that have been made this quarter, but it is probable that as we move into October index traders will be looking for excuses to test the conviction behind the recent gains.
The chart for the Russell 2000 cash index (^RUT) shows a tiny body Doji formation that leaves the index one percent below the important 740 level.

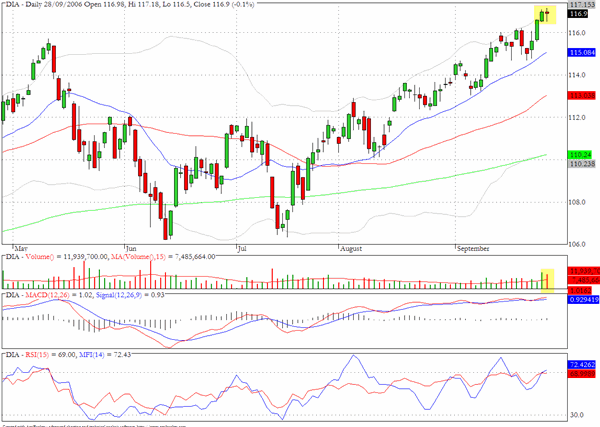
The Dow Jones Industrials closed at 11718 which was four points shy of the all time high registered on January 14, 2000. Volume for the proxy instrument DIA has picked up in the last couple of sessions and in similar fashion to the S&P 500 the close yesterday sits exactly on the upper 50-day volatility band.
TRADE OPPORTUNITIES/SETUPS FOR FRIDAY SEPTEMBER 29, 2006
The patterns identified below should be considered as indicative of eventual price direction in forthcoming trading sessions. None of these setups should be seen as specifically opportune for the current trading session.
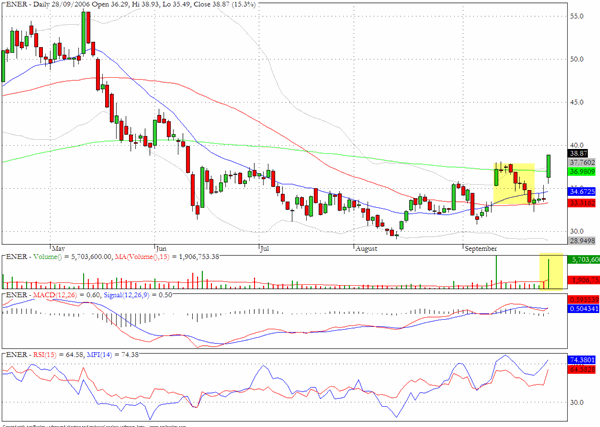
In Wednesday's commentary we commented that ENER could be preparing to attempt a breakout from the long standing sideways pattern that extends back to mid-June. The stock mounted a very strong rally yesterday with a fifteen percent gain on the day.
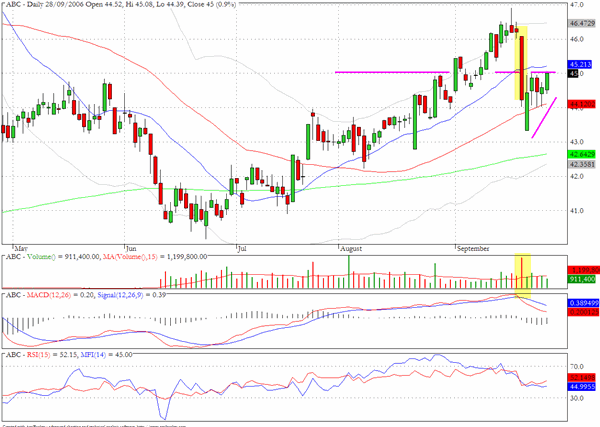
Amerisource Bergen (ABC) faces a potential hurdle at the $45 level
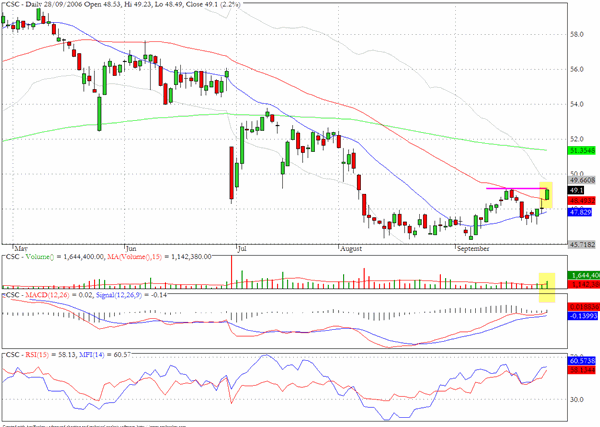
Computer Sciences (CSC) is showing evidence of accumulation and closed above its 50-day EMA on substantial volume yesterday. It could be headed towards $54 and perhaps sentiment was given a boost yesterday by the announcement that it had been awarded a major contract by the British government.
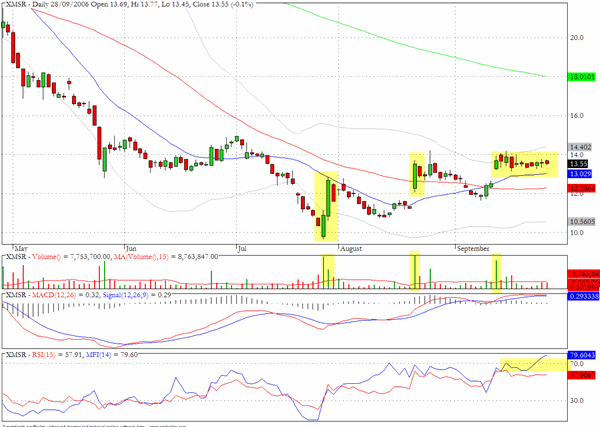
We will be watching XMSR today as it has approached a critical juncture close to the $14 level. One possible interpretation of recent price action is that it represents the third flag like formation since basing in late July. The characteristics of the current formation do not exactly fit the bull flag template and we are hesitant to accept the bullish argument until further evidence presents itself. It is also plausible that a failure pattern is developing which could precipice a further bout of weakness.
Clive Corcoran is the publisher of TradeWithForm.com, which provides daily analysis and commentary on the US stock market. He specializes in market neutral investing and and is currently working on a book about the benefits of trading with long/short strategies, which is scheduled for publication later this year.
Disclaimer
The purpose of this article is to offer you the chance to review the trading methodology, risk reduction strategies and portfolio construction techniques described at tradewithform.com. There is no guarantee that the trading strategies advocated will be profitable. Moreover, there is a risk that following these strategies will lead to loss of capital. Past results are no guarante of future results. Trading stocks and CFD's can yield large rewards, but also has large potential risks. Trading with leverage can be especially risky. You should be fully aware of the risks of trading in the capital markets. You are strongly advised not to trade with capital.