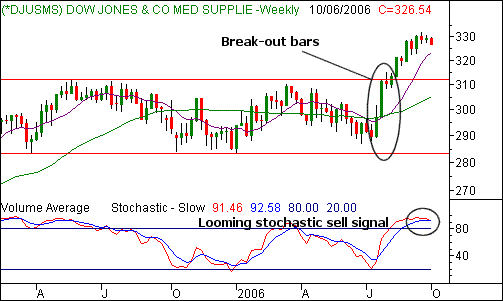
In mid-July, it looked like the medical supply companies were riding a rocket to the moon. Over the span of two weeks, the Dow Jones Medical Supply Index (DJUSMS) surged 7.5%, putting it right under a key resistance line. The week immediately after that, the index broke past resistance and continued to work higher, without ever really looking back. However, the same rocket ride now leaves all these stocks a little bit higher than they can handle.
Truth be told, it was actually a textbook bullish breakout over the last two weeks of July, and the first week of August. On July 14th, the Dow Jones Medical Supplies Index closed at a multi-week low close of 289.63, and looked set to go even lower. The next week, however, ended up catching most everybody off guard, as the index surged to close at 297.04. The week after that, the close of 311.34 left the index challenging highs set in May of 2005. Based on the two back-to-back ultra-strong bars, we would have at least put the index on our watchlist. The primary concern would have been a repeat of the same pullback we saw at the same level a little over a year earlier...would the 311 area be resistance yet again?
Of course, we can see that it wasn't. The following week, 311 was breached briefly, and by mid-September, we were seeing closes above 311. So, the resistance had indeed been broken. True to the set up, the Dow Jones Medical Supplies Index followed through to the upside, reaching as high as 331.85 a couple of weeks ago. Of course, that's when this 'textbook' bullish chart ran into 'textbook' bearish problems that suggest a decent correction is looming.
After getting to 331.85 in mid-September, we've seen nothing but lower highs, and mostly lower lows. Yesterday's 0.8% slide wipes away the last month's worth of gains...something that shouldn't happen in a viable uptrend. So, we know the bulls are losing steam. However, we'll even go as far to say the bears - or at least the sellers - are now taking over this over-extended industry. We can see how the struggle started when we worked our way into a stochastic 'oversold' condition, and with both of the stochastic lines now pointed lower, a full-blown stochastic sell signal is imminent.
As for a target, we don't see the 50 day line (purple) at 323 stopping this rapidly-accelerating freefall. Rather, the 200 day line (green) at 305 is the more likely stopping point. But even then, it's not like the 200 day line has been flawless support (just look back over the last year or so). If the 200 day line breaks as support, we'll extend our bearish target all the way down to straight-line support at 283. Stops on this bearish bias come with any close above the recent peak at 331.
Dow Jones Medical Supply Index (DJUSMS) - Weekly

Price Headley is the founder and chief analyst of BigTrends.com.