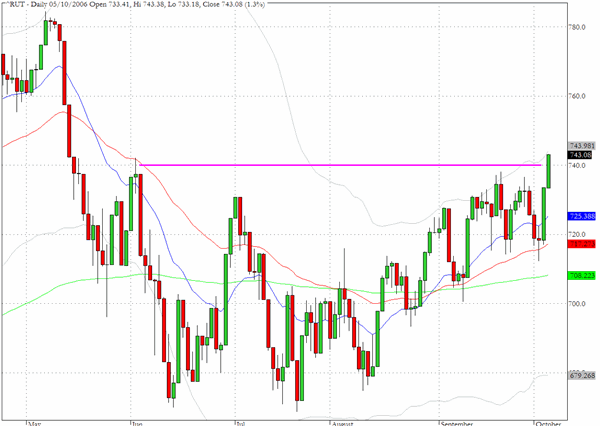
We have commented several times recently on the significance of the 740 threshold for the Russell 2000 (^RUT). The index finally closed above this level in yesterday's trading for the first time since the onset of the May correction. While it is not showing the leadership characteristics that were evident earlier this year the catch-up that is now taking place in this index and the Nasdaq Composite lends market breadth support to the new DJIA high inspired rally.
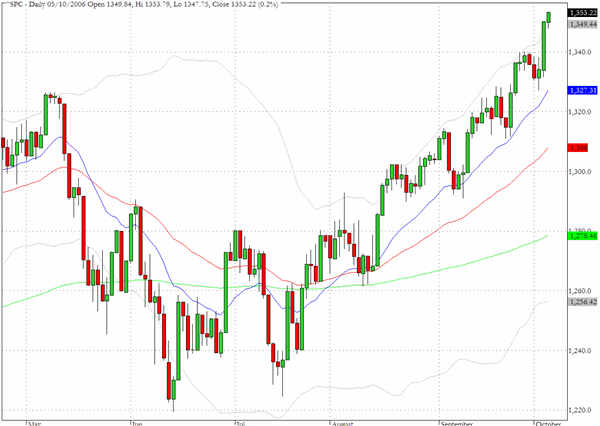
The S&P 500 followed Wednesday's trend day with a narrow range candlestick that pushed the index to the 1353 level which lies on the upper volatility band. The release of key statistics today carries the possibility of triggering a re-appraisal of underlying economic conditions but, in support of the recent advances, many individual charts that show recent breakouts are being validated by continuations and extension patterns.
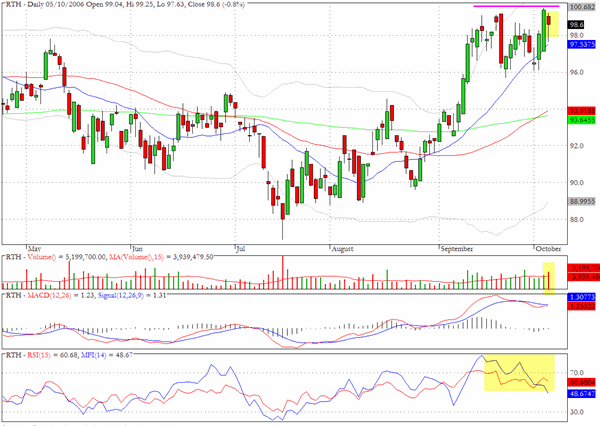
RTH, the exchange traded retail sector fund, has enjoyed a more than ten percent recovery since mid July. The chart pattern contains some evidence of increased intraday volatility with the two long candlesticks, both red and green within the last month and the momentum and money flow that helped to drive the rally through September appears to be dissipating.
TRADE OPPORTUNITIES/SETUPS FOR FRIDAY OCTOBER 6, 2006
The patterns identified below should be considered as indicative of eventual price direction in forthcoming trading sessions. None of these setups should be seen as specifically opportune for the current trading session.
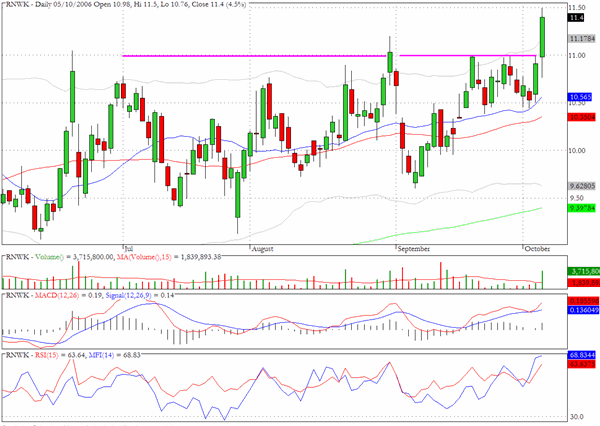
Real Networks (RNWK) broke out from a long standing trading range on more than twice the average daily volume.
Reliance Steel (RS) which we discussed on Monday in the context of an emerging bull flag formation followed through yesterday with a more than five percent advance and there is evidence of continuing accumulation.

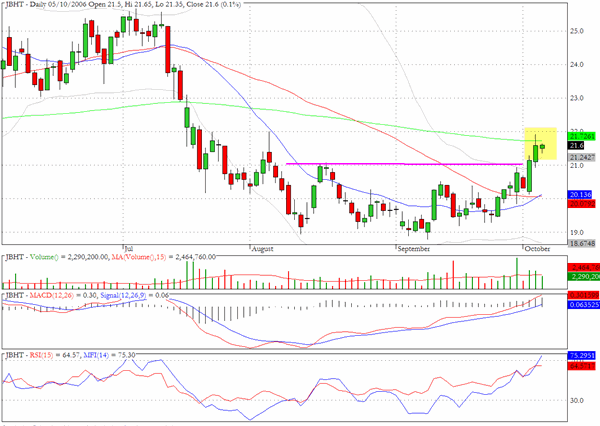
JB Hunt Transport (JBHT) looks ready to take on the chart hurdle in the vicinity of $22 and there has been noticeable accumulation in the last several sessions.
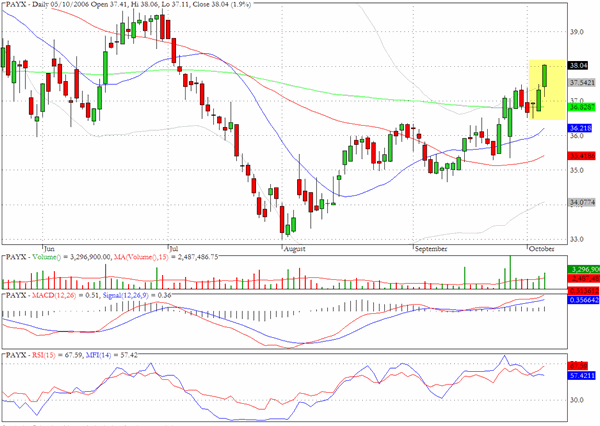
Paychex (PAYX) appears to have broken loose from the shackles of the 200 day EMA and the money flow is unusually positive.
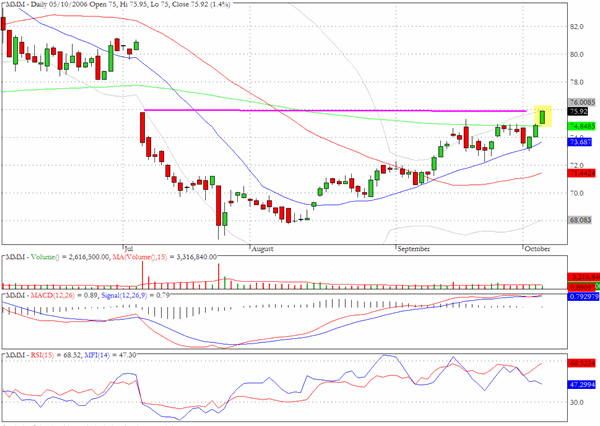
3M Company (MMM) has a clearly defined saucer bottom formation and has returned to the early July post-gap level. A cautionary note is suggested as the volume chart is relatively featureless and there is no pattern of accumulation.
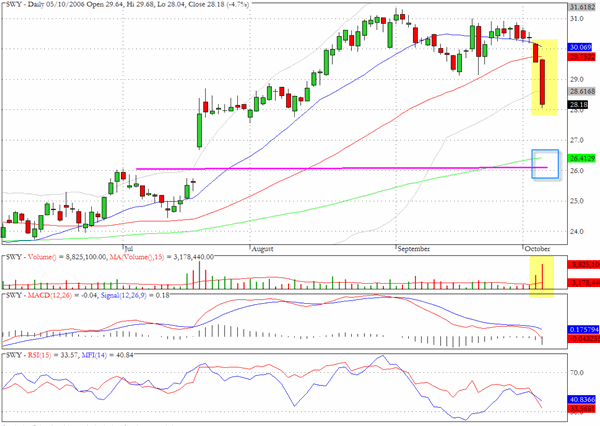
Safeway (SWY) has experienced two days of notable selling after registering lower highs during the month of September. $26 would likely be an eventual target.
Clive Corcoran is the publisher of TradeWithForm.com, which provides daily analysis and commentary on the US stock market. He specializes in market neutral investing and and is currently working on a book about the benefits of trading with long/short strategies, which is scheduled for publication later this year.
Disclaimer
The purpose of this article is to offer you the chance to review the trading methodology, risk reduction strategies and portfolio construction techniques described at tradewithform.com. There is no guarantee that the trading strategies advocated will be profitable. Moreover, there is a risk that following these strategies will lead to loss of capital. Past results are no guarante of future results. Trading stocks and CFD's can yield large rewards, but also has large potential risks. Trading with leverage can be especially risky. You should be fully aware of the risks of trading in the capital markets. You are strongly advised not to trade with capital.