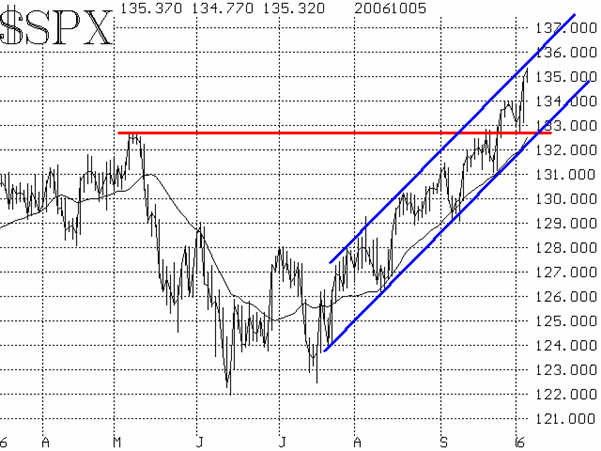
Much ado has been made about the fact that the Dow is now at all-time highs. Proponents (bulls) say this is terrific, and it's only a matter of time until the other indices follow. Cynics (bears) have cited a litany of problems, including 1) none of the other major broad-based indices is even close to an all-time high, 2) the average Dow stock is actually 32% below its 2000 peak, meaning that the Dow was dragged to these high by a handful of stellar performers (an event made possible by the fact that the Dow is a price-weighted index, not a capitalization-weighted one), and well, you get the idea. However, the fact remains that the Dow is at an all-time high and $SPX has broken out to new 5+ years highs. These simple facts mean that the upside momentum is strong and therefore the charts of these indices are bullish

$SPX tested support at 1325-1327 on Tuesday of this week before breaking out to those multi-year highs. Thus that support level is strong. As long as $SPX remains above there, the picture is bullish.
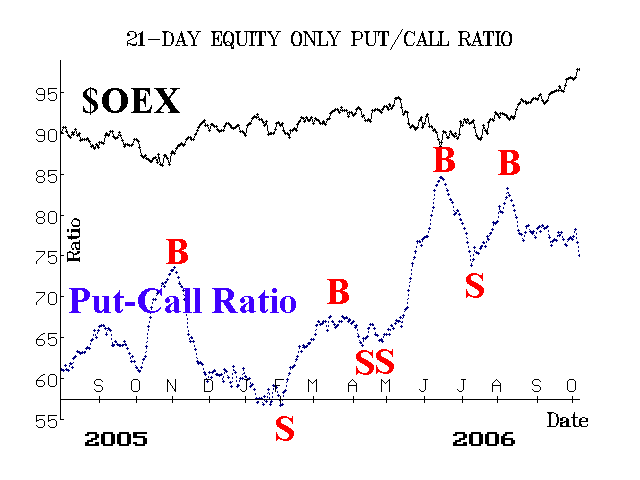
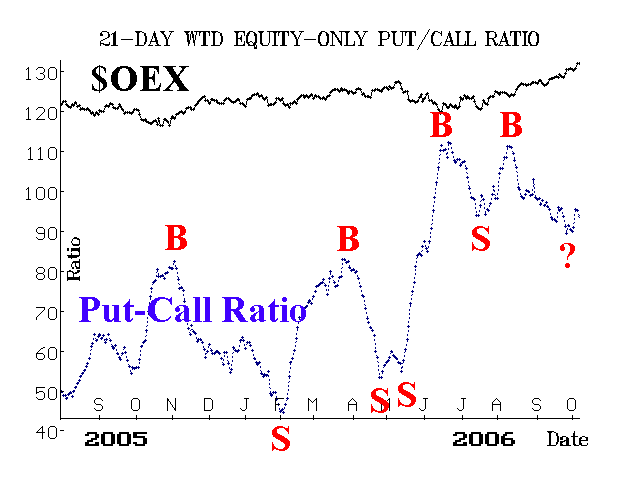
The equity-only put-call ratios remain on intermediate-term buy signals. This is true, despite their moving a little higher earlier in the week. But today, the standard ratio finally dropped to a new relative low and that's bullish (Figure 2). The weighted ratio, however, remains above its lows made last week (see Figure 3). To the naked eye, this is a budding sell signal. However, our computer analyses do not confirm such a sell signal at this time.


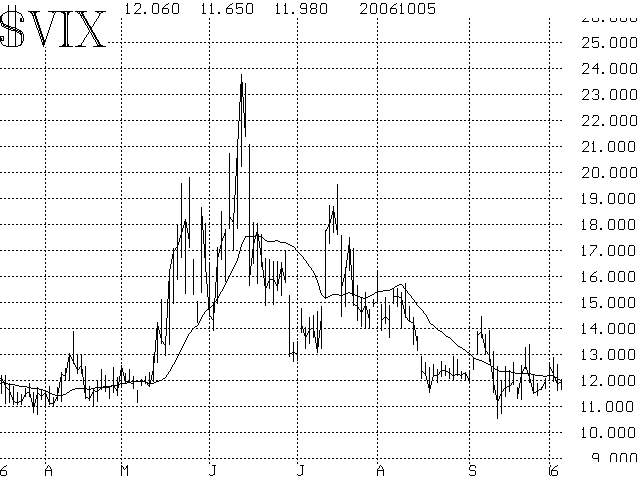
Finally, the volatility indices ($VIX and $VXO) continue to hover below 12, but haven't really dropped any farther during the most recent rally phase. One can consider them "overbought" at these low levels. Furthermore, it appears that index option sellers are not willing to push premiums any lower at the current time, despite the continuing rally. The market can continue to rally while these indicators remain at these low, "overbought" levels. We would still consider any $VIX close above 12.70 as an initial sell signal.

In summary, the market remains intermediate-term bullish and short-term overbought. As such, short and perhaps sharp corrections are possible, but unless $SPX falls below 1325 -- and is accompanied by confirmed technical sell signals when it does so -- we would remain bullish.
Lawrence G. McMillan is the author of two best selling books on options, including Options as a Strategic Investment, recognized as essential resources for any serious option trader's library.