NASDAQ Commentary
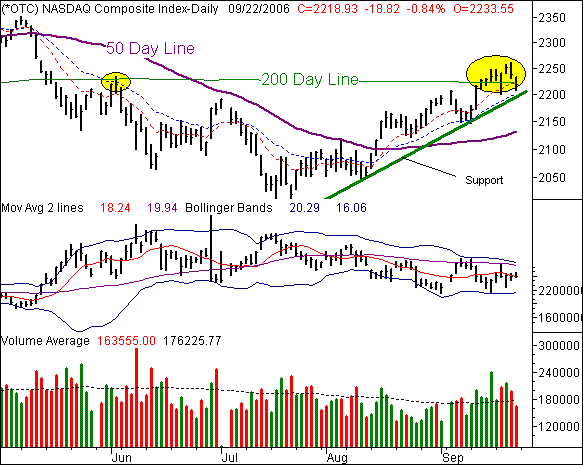
The NASDAQ's ended the week on a bearish note, losing 6.35 points on Friday (-0.28%) to close out at 2299.99. For the week, that still translates into a gain of 41.56 points above last Friday's close...a 1.84% gain. It was once again a case of two steps forward, and then one step back. The bulls are indeed gaining, but they're doing it the hard way. And if the zig-zag pattern we've seen for the last three months continues to play out, we may see a modest pullback to a major support line. As long as it holds, though, it shouldn't be a big deal for the bulls.
Check out the two major trend lines on the chart; the support is green, while the resistance is red. Since July, these rising lines have framed a rather bullish channel. And, until one of those lines breaks, we're not inclined to really get in the way of that uptrend. The lower support line is now at 2238, but will be at 2244 on Monday. Of course, it rises a little more each day, so be sure to make the adjustment if you're following the story on your own charts. By Tuesday, it will be around 2250...which is probably when the issue will be forced. Note that the 20 day average line (blue) is also likely to act as support, at around the same level. Unless we see a breakdown around there, it's possible the trend could continue to stay this bullish - despite the odds.
On the other hand, if all of that support breaks, it would be the first time the bulls had been really threatened since June. A tumble back down to the 100 day line at 2150 would be possible. And, with the market being as vulnerable as it is right now, it's something everyone should be watching.
Why is it vulnerable? Two reasons. The first one is the VXN (again). It's still showing us an amazing amount of confidence and complacency. VXN readings this low usually signal an impending attitude adjustment - in the form of a correction. Of course, we've been 'due' for such a VXN-based correction for weeks now...and it hasn't happened yet. The second reason stocks are vulnerable is the steepness of our bullish trading zone. Overall, the third quarter's rise was a much bigger (faster) rally than usual. The term 'the bigger they are, the harder they fall' applies here too. Once we get a little profit-taking, we expect to start a chain reaction of sorts.
Of course the question remains....when?
NASDAQ Chart

S&P 500 Commentary
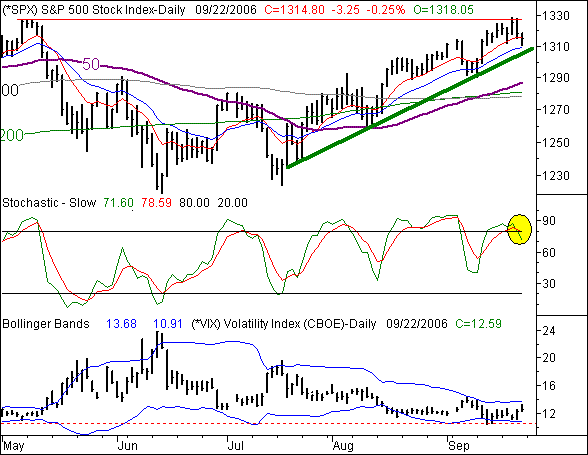
The S&P 500's 0.27% slide on Friday - the result of a 3.64 point dip - left the large cap index at 1349.58. That was 13.75 points higher than the previous week's close, meaning the SPX managed to keep 1.03% of its weekly gain. However, it also needs to be said that Wednesday's heroically bullish move may have encouraged some profit-taking, which in turn could have set up a selling spree in the coming week. Either way, the lack of follow-through on Thursday, paired with Friday's lull, suggests we may slip lower before we head any higher.
The S&P pretty much looks like the NASDAQ, in that it's being guided upward by a fairly narrow set of support and resistance lines (green, and red, respectively). The upper line - at 1354 on Thursday - did indeed manage to send the index lower by Friday, after the SPX had spanned the height of the channel. If the pattern persists, the SPX will meet the support line sometime in the middle of the coming week. It will be at 1328 on Monday, at 1334 on Wednesday, and at 1343 by Friday. Keep an eye on that mark as an early warning of any breakdown.
If it does break, the fall could lead the index all the way back to its 200 day line, at 1285. Of course, there's really no certainty of such a breakdown....we'll have to wait and see.
However, there are two things that make us ready to quickly switch gears if the bearish breakdown actually occurs.
The first is the stochastic 'overbought' condition. However, it's also worth noting that being overbought hasn't been a major problem in the last few weeks. Each time we've gotten overbought, the only result was a pullback from the upper resistance line just back to the lower support line. So, it's a bit of a tainted bearish signal.
The second reason is the low VIX. The market has been content to keep it low...which is bullish as long as they want to keep buying. But, once traders change their minds, the VIX could surge higher, and push stocks lower in a big way on a short period of time....the same vulnerability the NASDAQ has. Look for a break above the VIX's resistance line (dashed) as a red flag....which isn't all that far away.
S&P 500 Chart

Dow Jones Industrial Average Commentary
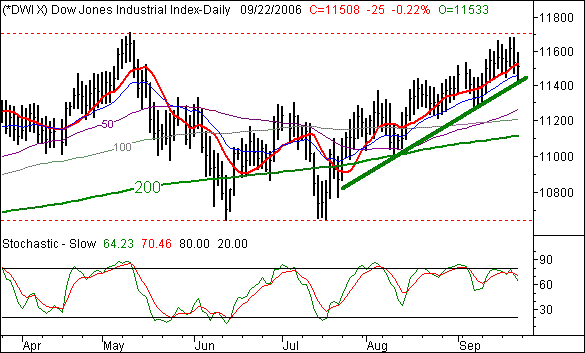
The Dow Jones Industrials were the 'least weak' on Friday, only giving up 0.14%, or losing 16.48 points. On a weekly basis, the Dow found itself in the middle (in terms of performance), as it gained 1.46% (171 points) over the last five sessions. Perhaps more importantly - perhaps not - the week's close at 11,850 was a new high weekly close...the former one was 11,723, from January 14th, 2000. This past week's high of 11,928 was also a new intra-week high. Again, the previous high was hit during the week-ended on January 14th, 2000, when the index reached 11,909. In some regards it's exciting for the bulls, as it could encourage more buying. In other regards, there's some valid concern that it's all excuse the market needed to start selling in a significant way.
Support is at 11,590, while there is no meaningful resistance line. As for the dynamics, the same outlook and problems as the S&P 500 and NASDAQ also apply to the Dow.
Dow Jones Industrial Average Chart

Price Headley is the founder and chief analyst of BigTrends.com.