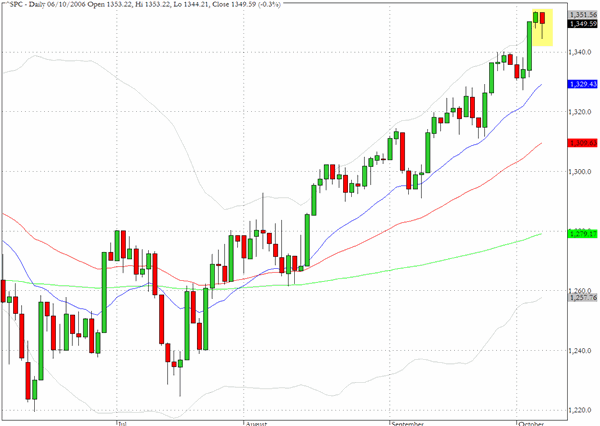
The S&P 500 cash index (^SPC) opened on what turned out to be its high for the day. The market digested the employment report which contained something for both camps as it showed weaker job growth than expected in September but a healthy revision upward in the August figure. During the session news that Kirk Kerkorian will not be increasing his stake in GM caused an attack of vertigo but the indices regained their composure and closed largely unmoved by the day's developments.
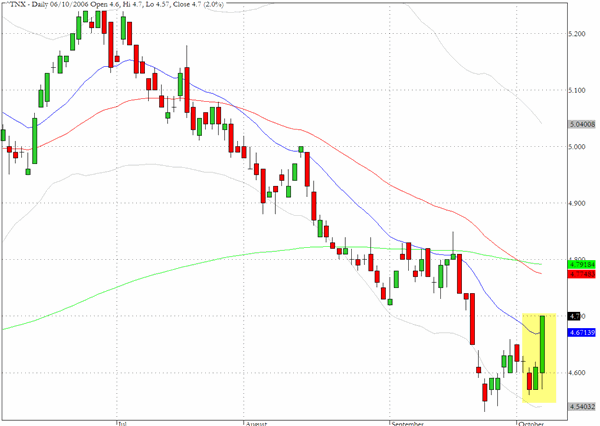
Although the equity indices were largely unmoved by the employment data there was a pronounced slump in Treasury bond prices across the yield spectrum. The ten year note lost twenty three ticks and its yield moved up to 4.7%. After looking as if it was going to peek below the 4.5% level in the last two weeks traders appear to have been unsettled by the stronger than expected revision to the August non-farm payrolls.
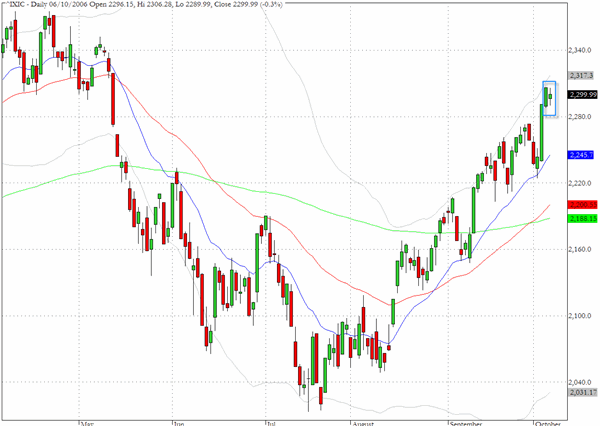
The chart for the Nasdaq Composite index (^IXIC) shows an intriguing inside day spinning top formation that is perhaps even more remarkable given the news that the markets had to digest on Friday. It will be interesting to see whether the negative reaction from Treasury traders to the employment report spills over into the equity markets this week.
TRADE OPPORTUNITIES/SETUPS FOR MONDAY OCTOBER 9, 2006
The patterns identified below should be considered as indicative of eventual price direction in forthcoming trading sessions. None of these setups should be seen as specifically opportune for the current trading session.
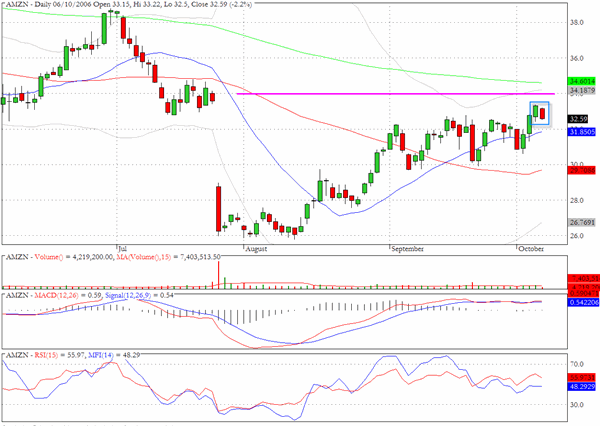
Amazon (AMZN) registered an inside day formation on Friday and in view of the recovery pattern now reaching back towards the $34 level which marked the level preceding July's big sell off some corrective action may be in store. Additionally the 200 day EMA lies just above the area of possible chart resistance.
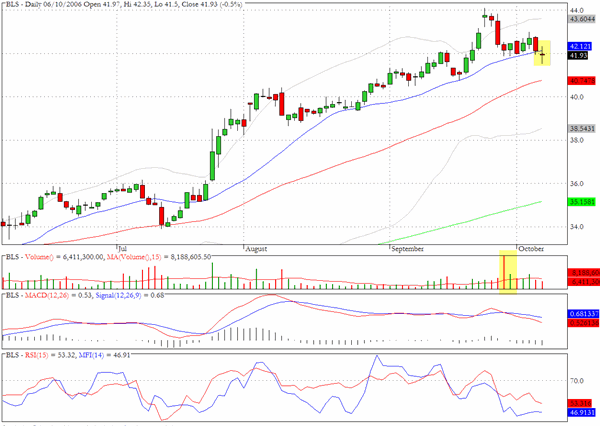
The chart pattern for BellSouth (BLS) shows negative divergences in momentum and money flow and Friday's Doji was accompanied by a close below the 20-day EMA.
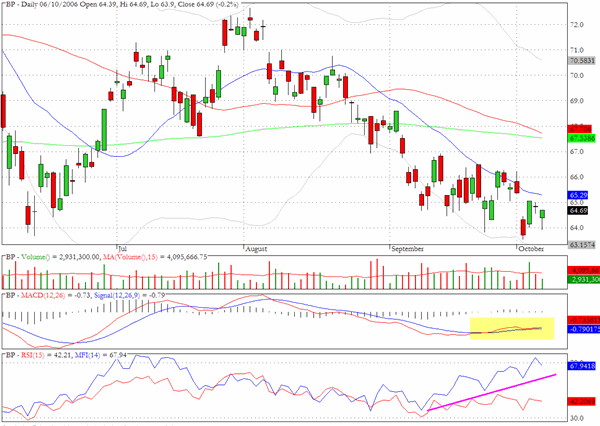
BP has the converse pattern to BLS with evidence of positive divergences and accumulation.
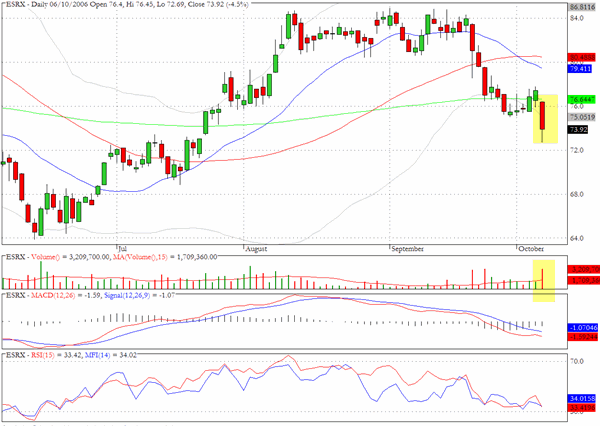
Express Scripts (ESRX) dropped by more than four percent on twice its average daily volume and closed below the 200 day EMA.
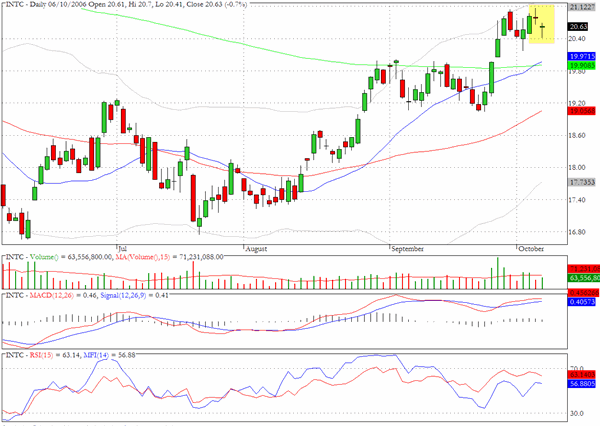
The recent price pattern for Intel (INTC) clearly shows the breakout above the $20 level and the 200 day EMA but the two most recent candlesticks could be pointing to some indecision about the near term direction.
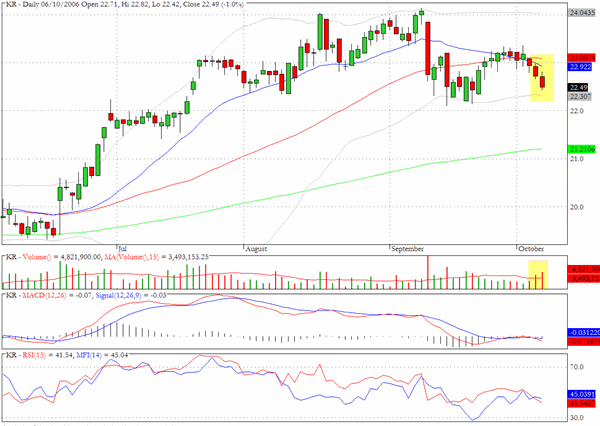
A week ago we commented that the chart for Kroger (KR) seemed to be pointing to possible weakness. The last two sessions of last week are showing a pick up in volume as the stock continued to fall further below the 20 and 50 day EMA's.
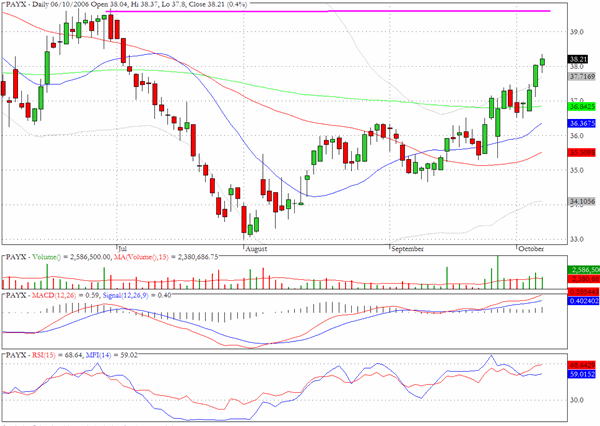
Paychex (PAYX) was also featured recently as we observed that it appears to have broken loose from the shackles of the 200 day EMA and it would seem that the highs from June should be targeted in coming sessions.
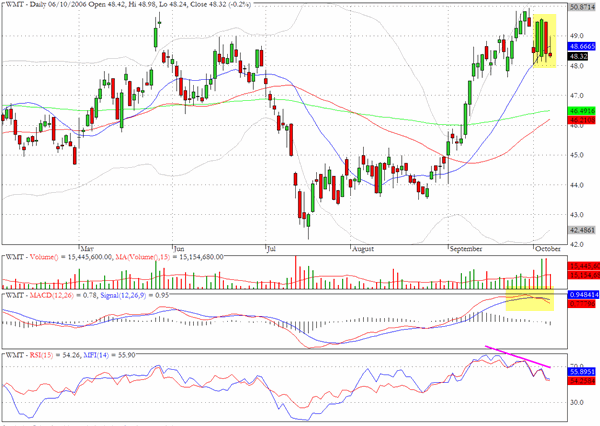
Many stocks in the retail sector experienced positive momentum during September but some are now looking over-extended in the near term. WalMart (WMT) is also displaying some range expansion and reversal behaviour.
Clive Corcoran is the publisher of TradeWithForm.com, which provides daily analysis and commentary on the US stock market. He specializes in market neutral investing and and is currently working on a book about the benefits of trading with long/short strategies, which is scheduled for publication later this year.
Disclaimer
The purpose of this article is to offer you the chance to review the trading methodology, risk reduction strategies and portfolio construction techniques described at tradewithform.com. There is no guarantee that the trading strategies advocated will be profitable. Moreover, there is a risk that following these strategies will lead to loss of capital. Past results are no guarante of future results. Trading stocks and CFD's can yield large rewards, but also has large potential risks. Trading with leverage can be especially risky. You should be fully aware of the risks of trading in the capital markets. You are strongly advised not to trade with capital.