Good day! The past week of record-breaking trading ended on a slow note on Friday. Thursday's range-bound type of trading persisted into the weekend. The day began with a gap slower following premarket jobs data. Jobs growth slowed in September to the slowest pace of the past year. U.S. nonfarm payrolls rose by about 51,000. They were anticipated to rise by 123,000. July and August payrolls, however, were revised higher by 62,000. Breaking down the numbers, the manufacturing sector lost jobs again to the tune of -19,000, while the retail sector lost 12,000 jobs. The construction sector gained 8,000, while the health care and finance sectors saw the strongest jobs growth. Additionally, the unemployment rate fell to 4.6% from the prior month's 4.7%. Treasury prices declined with the news, creating higher yields as hope of a Fed rate cut were dampened.
The final results from Friday's sessions came in at a loss in all three of the major indices. The Dow Jones Industrial Average ($DJI) fell 16.48 points and closed at 11,850.21. The S&P 500 ($SPX) lost 3.64 points and ended the session at 1,249.58. The Nasdaq Composite ($COMPX) declined 6.35 points. It finished the week at 2,299.99. The semiconductors and internet sector saw some of the largest losses with news from Micron Technology (MU) of weak quarterly results and a coverage call on eBay (EBAY). Other top decliners on the session were GM, CVS, CMX, HMS, CCI, MCK, CAH, AEOS, MOBE, ESRX, and SEIC. On the opposite side DD, THI, MA, ACOR, SNDK, GOOG, KLAC, SBAC and FLSH all posted strong gains.
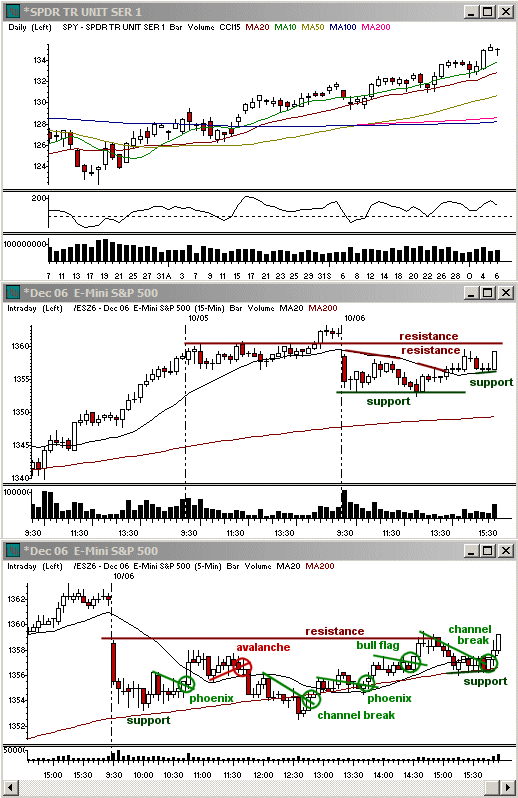
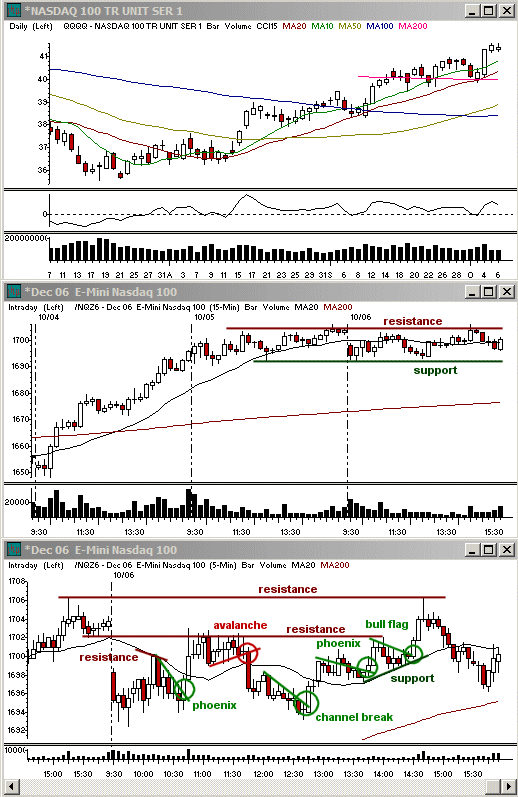
Most of the downside in the overall indices materialized by 10:00 ET. By that point the Nasdaq Composite had hit Thursday's mid-day lows and the S&P 500 and Dow Jones Ind. Ave. were coming into the support zone of their 5 minute 200 simple moving averages. The day was off to a choppy start, however, and the indices turned around only with a great deal of hesitation that would mark the remainder of the session, albeit to a slightly lesser degree.
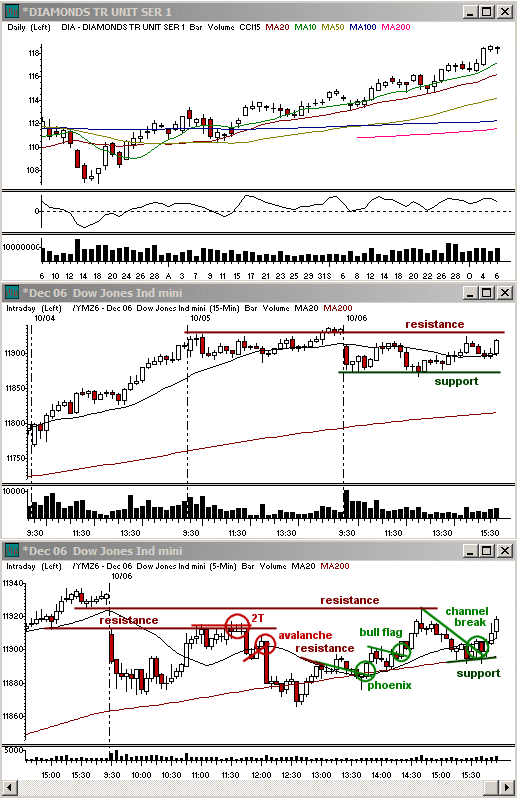
Support and resistance levels held fairly well throughout the session, but a lot of the day was spent simply ricocheting back and forth between them. After finding support early on, the market climbed throughout most of the remainder of the morning, attempting, but not quite succeeding, to fill the morning gap. The S&P 500 had the most difficult time with this feat. By 11:00 ET many of the buyers had fallen to the sidelines. The indices again rounded off intraday, this time at highs. The pattern was a bit more clear cut this time around with a change of pace showing with a 2T high in the Dow and Avalanche pattern in the Nasdaq on the 5 minute charts. The first occurs when the market moves to a slightly higher high at a slower pace and on lighter volume. The second is similar, but minus the higher high. Both indicate a change in momentum and they led to selling into noon which took the indices back into the zone of the day's lows.
The market turned around a third time into the early afternoon, once more moving higher off the lower trend channel. The buying came in three waves, but lacked volume. In fact, the volume as a whole throughout the climb was significantly less than the volume earlier in the day. It spiked slightly as the Nasdaq managed to make its way back to the prior day's highs, but that third and final move off afternoon lows exhausted the upside and the bears returned for a final time shortly after 14:30 ET. The 5 minute 200 sma in the S&Ps and Dow held as support for the remainder of the day.
We are likely to start to see some more momentum action in individual stocks beginning this week. The Treasury market will be closed on Monday in observance of Columbus Day, but the stock market will be open for a full day of trading. Tuesday brings with it the start of third quarter earnings season. This is where we will find the most excitement. The Nasdaq still has that extra room until it runs into strong monthly resistance from earlier this year, but while I don't see anything to indicate a larger correction off highs at this point, a retest of those levels would stand a good chance of doing just that. 2375.45 is the high of the year in the Nasdaq Composite to date.
Economic Reports and Events
Oct. 9: -
Oct. 10: Wholesale Inventories for Aug. (10:00 am), Treasury Budget for Sep. (2:00 pm)
Oct. 11: Crude Inventories 10/06 (10:30 am), FOMC Minutes Sep. 20 (2:00 pm)
Oct. 12: Initial Claims 10/07 (8:30 am), Trade Balance for Aug. (8:30 am), Fed's Beige Book (2:00 pm)
Oct. 13: Export Prices ex-ag, Import Prices ex-oil, Retail Sales, & Retail Sales ex-auto for Sept. (8:30 am), Michigan Sentiment-Prel. for Oct. (9:50 am), Business Inventories for Aug. (10:00 am)
Earnings Announcements of Interest
Only stocks with an average daily volume of 500K+ are listed. List may not be complete so be sure to always check your stock's earnings date before holding a position overnight.
Oct. 9: -
Oct. 10: EMMS, AA, CHTT, CMGI, DNA, LPL, SVU
Oct. 11: ACGY, GCI, HST, LRCX, MON, YUM
Oct. 12: COST, GENZ, JRC, MTG, PEP, PII, SWY, WGO
Oct. 13: FNFG, GE, PKX, RF
Note: All economic numbers and earnings reports are in lines with those compiled by Yahoo Finance. Occasionally changes will occur that are made after the posting of this column.
Toni Hansen is President and Co-founder of the Bastiat Group, Inc., and runs the popular Trading From Main Street. She can be reached at Toni@tradingfrommainstreet.com.


 Free Festival of Traders Videos