Try as we might, the mainstream sectors just didn't offer us anything that was both new, and compelling. We got a lot of either/or, like energy's demise Monday. But, it's been weak in the face of a mostly-bullish market for several days now. Nothing new there. Or, we could discuss technology's reclamation of the top spot. But again, that's nothing new either. Basic materials got shaken up again on Monday, but they've been so up-and-down lately, there's not any meaningful (i.e. predictive) chart pattern there. So, we're forced to drill-down further into the sectors again into the industries. Today's industry focus? The bullish potential of life insurance stocks. Then, we've got a close second.
We'll be examining the chart of the Dow Jones U.S. Life Insurance Index (DJUSIL), one of the few insurance-based indices out there, and the only life insurance index we're aware of. Key holdings in this index include like AXA (AXA), Metlife (MET), and Prudential (PRU).
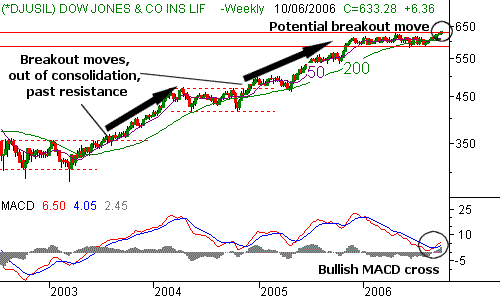
The index had been stuck in neutral for most of 2006, and as of July of this year we were actually leaning on the bearish side of things for the chart. The bulls had other plans though, making a bottom at 588 in August, and running pretty much unchecked up to the current reading of 633.59, which is a 7.7% run. And more than that, we think there could be more of the same in store.
Why? There are basically two reasons. The first is simply a break past resistance at 628. That was the high hit in April of this year, and also the beginning of a long dry spell for the index. Obviously that level wasn't a problem this time around - the move above it constitutes a bullish breakout effort.
The other reason is more potential-based. The Dow Jones U.S. Life Insurance Index can and has started long - and big - moves with chart patterns that look very much like the current one. The dry spell this year may have just been a good consolidation period, and set up a bigger move for the latter half of the year. In fact, our long-term chart below verifies that this index has a habit of staying flat for months at a time, then putting up a big rally out of that lull. The 2002 and 2004 lulls were both followed by rallies in 2003 and 2005. Perhaps 2007 (and even late 2006) will offset the lull we've seen for most of this year. If so, a 120 point move isn't out of the question.
Therefore, we'll set a target of 750 for the Dow Jones U.S. Life Insurance Index. Just keep in mind that it could take months to get there. Our stop on this bullish bias comes with any close back under the 200 day moving average line at 607. Take a look at the chart, and don't forget to keep reading below for our take on the industry we almost wrote-up.
Dow Jones U.S. Life Insurance Index - Weekly

The Close Second -- Biotech
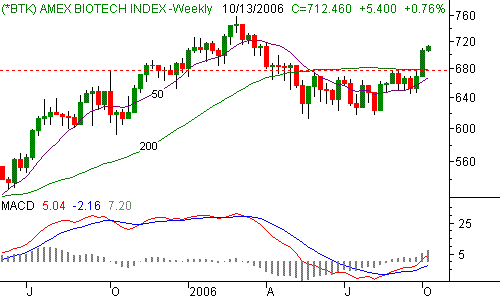
Biotech stocks suffered longer than the rest of the market did earlier this year, and really didn't participate all that well in the July-thru-September rally. We had initially wondered if it was a symptom of a bigger problem. However, the AMEX Biotech Index (BTK) more than made up for lost time last week by gaining 5.6%, and shooting past its 200-day moving average line. It was a move that we saw the potential for, but resistance at 677 made the position a little too risky for most traders.
Now (and ironically), the problem is reversed. Rather than the industry being too cold, now it's too hot. We can't say the current reading of 712.46 would be a great entry point for long trades, as we're well past the 200-day line at 679. That line, along with the 50-day line at 668, tend to act as support upon any pullbacks. Although we feel the bigger picture is bullish, we would be surprised if there wasn't a short-term pullback or two before the longer-term uptrend runs out of gas. Those blips would make for much better entry points into this potential rally. If the lower of those tow lines fails to act as support at any time, then we'd be concerned that the rally was failing.
AMEX Biotech Index (BTK) - Weekly

Price Headley is the founder and chief analyst of BigTrends.com.