Thanks for all the great feedback regarding Tuesday's TRIN column. It sounds like a lot of you plan on applying the indicator to your trading. It also sounds like a lot of you would like to know more about other ways of looking at volume. That's great - volume really is an important factor in trend forecasting. One question we got was particularly important, as it recognized one of the shortcomings of the Arms Index (TRIN). Fortunately, there's a viable solution. Here's the question.
Q: What is the difference between Chaikin's Oscillator and Arms Index or TRIN and which one is better to follow if one is interested in determining a trend in a security rather than overall market?
The Arms Index (or TRIN) only applies to a group of stocks. In our case, it was NYSE stocks, but you could also use it for AMEX and NASDAQ stocks. For TRIN to work, it has to study a group of stocks, because the calculation compares the advancers to the decliners, and compares the advancing volume to the declining volume (for a total of four components). You can't apply it to just one security, because if you did, all of your test subject would either be an advancer, or a decliner. Also, all of your volume would be advancing volume or declining volume. In other words, you have to have multiple securities for the calculation to have any meaning. You can't get that with just one stock.
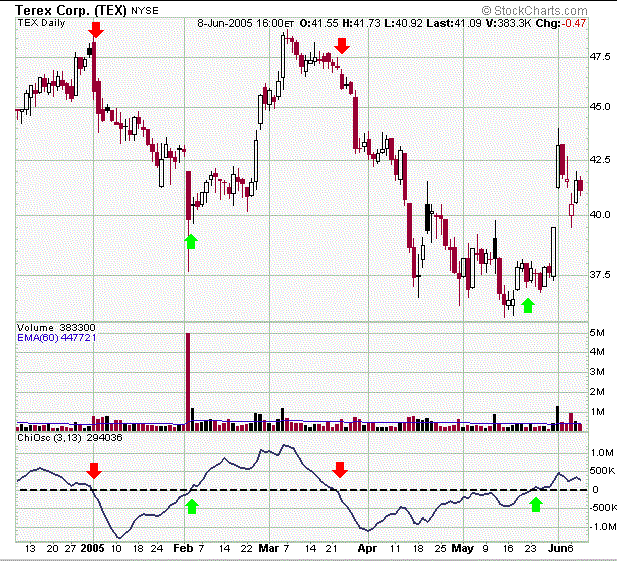
A Chaikin line, on the other hand, is a volume tool that can be applied to one security, or an entire index. It works for an individual security, because you only need two components - price change, and the trade volume on the day of that particular price change. Basically, a Chaikin line associates the daily price change with the volume for that particular day. The higher the volume is, the faster the Chaikin line moves. The theory is that important and sustainable moves occur on higher volume, and those are the ones you want to seek out. So, if you get a series of big gains and they're all on rising volume, the Chaikin line will indicate that. On the other hand, if you get a series of big price moves but the volume behind the move is weak, then the Chaikin line won't move as dramatically, if it moves at all. As always, a picture is worth a thousand words, so let's just plot a recent Chaikin line.
We just don't have time to get into the mechanics of the Chaikin line calculation. Let's just describe it as a volume-weighted momentum line. It's simply a single-line oscillator, centered around a zero line. As we mentioned above, the higher the volume and/or the bigger the stock price move, the faster the Chaikin line moves. On our chart below, Terex Corporation's (TEX) stock appears at the top, and its Chaikin line appears at the bottom. You can see how the Chaikin line changes direction with the stock. What may not be quite as apparent is that the Chaikin line often changes direction before the stock does. This goes back to something we mentioned last Thursday - volume trends tend to shift slightly ahead of price shifts. That predictive nature is why volume is so important to watch.
Terex Corporation (TEX) with Chaikin Line - Daily

One of the shortcomings will also be evident, if you look closely. The scaling of the Chaikin line is dependent on the average number of shares that trades for that stock. For Terex, that may be anywhere from 500,000 to 1 million per day. For other stocks, the average volume may only be 100,000 shares per day. That variance makes it tough to look for signals based on total volume, since it will change from stock to stock. The other challenge with the Chaikin line is finding a way to generate a "signal" at all. Most software doesn't allow you to plot a moving average of a Chaikin line, so you probably won't be able to use moving average crossovers to act as a trade trigger either.
Rather than work around those challenges, we've just incorporated into our trade signals the aspects that make a Chaikin line unique. Since it's centered around a center line at zero (called "normalization"), we've developed a system that just signals a new buy or sell whenever the Chaikin line is crossed. The sell signals are marked with red arrows, while the buy signals are marked with green arrows. (The zero line is the horizontal dashed line.) For Terex, this system was very effective, but they all aren't that easy.
In any case, to answer the question, a Chaikin line is one way of spotting volume trends for an individual stock. The Arms Index can't do this for an individual issue. Our signal system (zero line crossovers) was just one method of using it. I encourage you to look for other ways to use it as well.
That said, the other two volume indicators that are stock-specific are accumulation-distribution lines, and on-balance-volume. In fact, we got this question about both of those tools just yesterday.....
Q: When comparing the "on balance volume" verses the "accumulation/distribution lines", which should I consider more important as a buy or sell signal? For example when both are going up, I expect the stock price to rise, and conversely when both are falling I anticipate the stock price to fall. However when the accumulation/distribution line is moving counterpoint to the on balance volume line what could I expect with the stock price?
We can't answer it today, but we will look at both of these tools sometime next week. In the meantime, your homework is to work with a Chaikin line and apply a proven methodology to your trading. We'll pick up this discussion again in a couple of days.
Price Headley is the founder and chief analyst of BigTrends.com.