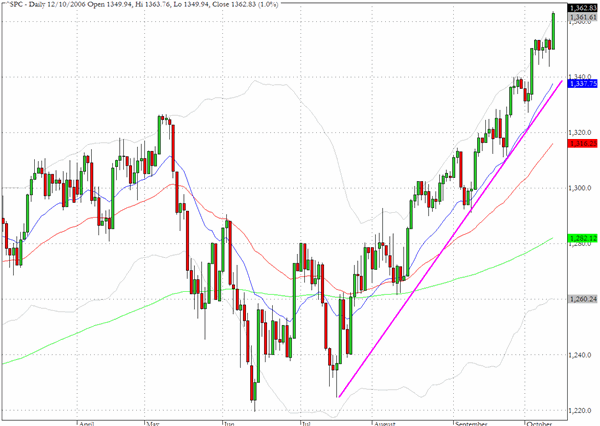
The equity indices shook off their recent lethargy and procrastination and mounted strong rallies yesterday resulting in several new multi-year highs. The S&P 500 index (^SPC) pushed forward another one percent to close at 1362. The trendline through the lows since July almost exactly tracks the 20-day EMA and underlines the very coherent nature of the bullish price behavior during the last ninety days.
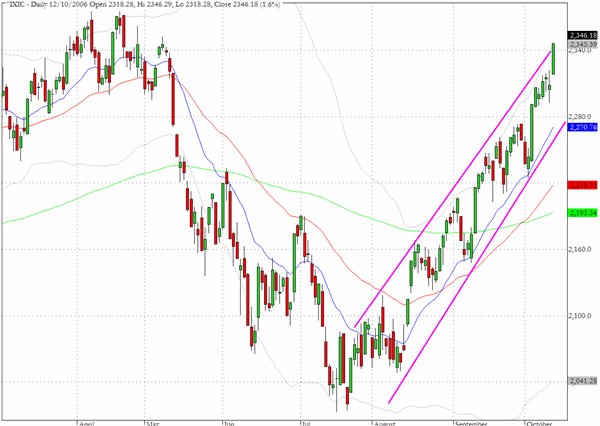
The Nasdaq Composite index (^IXIC) continued the extraordinary catch-up effort that has been gathering momentum since early September as it rose another 1.6%. The index closed yesterday within 25 points of the recent multi-year high that was achieved on April 19.
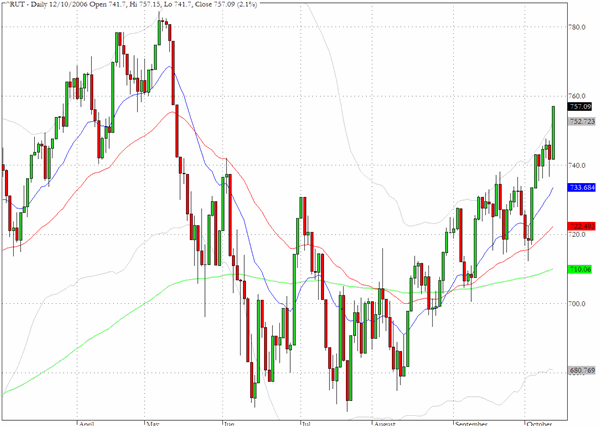
Notably the Russell 2000 (^RUT) participated in yesterday√Ę‚,¨‚"Ęs euphoria and outpaced all of the other broad indices with a 2.1% gain. The chart pattern and trend lines are less acute than the two previous charts but the confirmed break above 740 definitely puts the previous all time highs back in play.
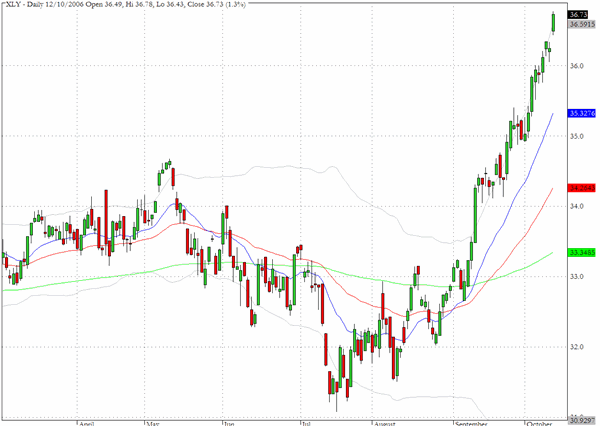
We have made this comment before but the chart of the ETF for the consumer discretionary sector, XLY, shows a remarkable almost parabolic ascent pattern in the last few weeks. The steep drop in energy prices provides the most likely explanation for the dramatically transformed behavior of the sector but the price action looks as if it has entered a manic phase.
TRADE OPPORTUNITIES/SETUPS FOR FRIDAY OCTOBER 13, 2006
The patterns identified below should be considered as indicative of eventual price direction in forthcoming trading sessions. None of these setups should be seen as specifically opportune for the current trading session.
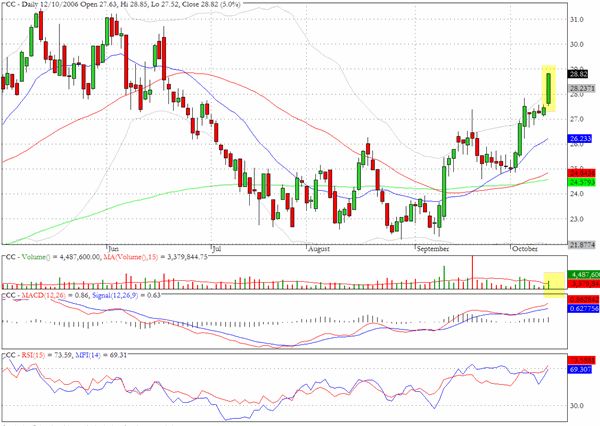
Circuit City (CC) surged five percent yesterday and seems to be in a hurry to test the May highs around $31.
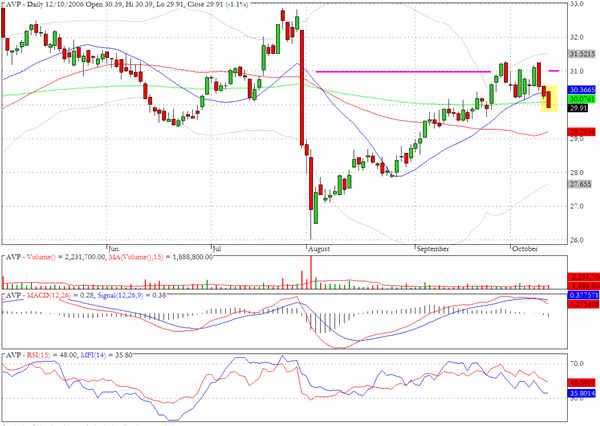
Avon Products (AVP) dropped below two of its moving averages yesterday. The chart pattern shows a significant retracement from the late July plunge but the recovery may have run its course.
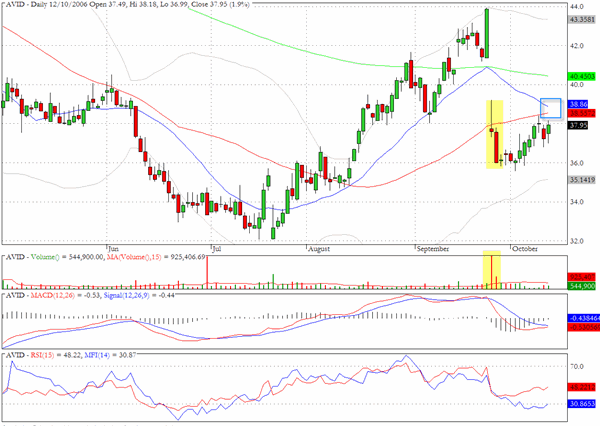
One of our preferred patterns is the recovery pattern that is close to having run its course. The chart for AVID suggests that the stock is entering an area of vulnerability. In particular the volume during the last several "recovery" sessions has been below average and dwarfed by the large gap down volume.
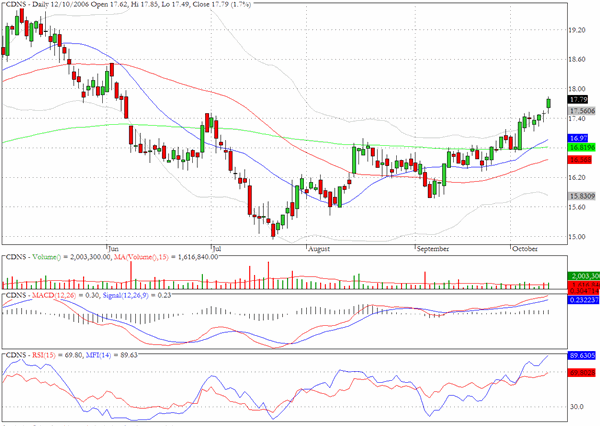
Cadence Design (CDNS) is building steadily on the recent breakout pattern.
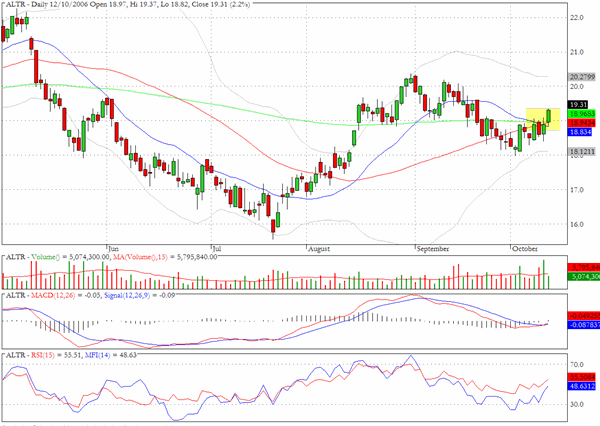
Altera (ALTR) has an interesting chart pattern in that all three moving averages have converged at the same price level and yesterday's close took out this potential barrier, although the volume was below average. We will be monitoring the stock in coming sessions for further evidence that would validate a breakout pattern.
Clive Corcoran is the publisher of TradeWithForm.com, which provides daily analysis and commentary on the US stock market. He specializes in market neutral investing and and is currently working on a book about the benefits of trading with long/short strategies, which is scheduled for publication later this year.
Disclaimer
The purpose of this article is to offer you the chance to review the trading methodology, risk reduction strategies and portfolio construction techniques described at tradewithform.com. There is no guarantee that the trading strategies advocated will be profitable. Moreover, there is a risk that following these strategies will lead to loss of capital. Past results are no guarante of future results. Trading stocks and CFD's can yield large rewards, but also has large potential risks. Trading with leverage can be especially risky. You should be fully aware of the risks of trading in the capital markets. You are strongly advised not to trade with capital.