NASDAQ Commentary
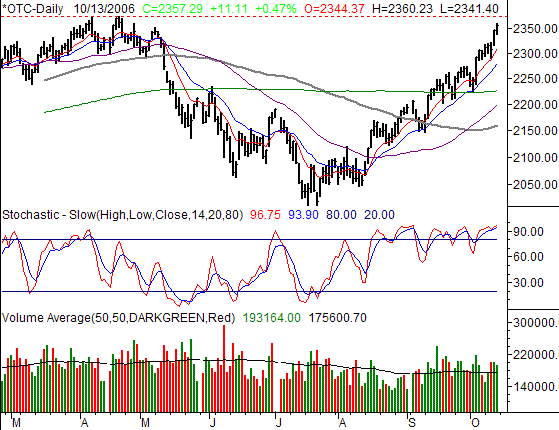
The NASDAQ's 11.11 point gain on Friday - a gain of 0.47% - left the composite at 2357.29 for the week. That was 2.49% higher than the prior Friday's close, thanks to the weekly gain of 57.30 points. While the bulls are probably happy with the results, we still contend that this recent, and excessive, strength is a likely setup for a bigger correction in the near future. And, the potential trigger is only 17 points away.
How will the market react when and if the composite finally makes it up to this year's high of 2375, hit in April? We can never say for sure, but we do know that the bulls should be aware that we're only 17 points under that mark right now. There's a good chance some major players will be using that line as a make-or-break line, and if traders flinch there, that may be just enough hesitation to start the profit-taking.
Plus, being as stochastically overbought as we are right now, the market remains particularly ripe for a pullback.
That being said, if the composite busts through 2375, don't think it can't just keep going. Stranger things have happened. As Keynes said, "The market can stay irrational longer than I can stay solvent." Continue to follow the trend as it is...not for what you think it should be, or will be in the future.
Of course, we have a strong counter-argument to bullishness in our S&P 500 discussion below.
NASDAQ Chart

S&P 500 Commentary
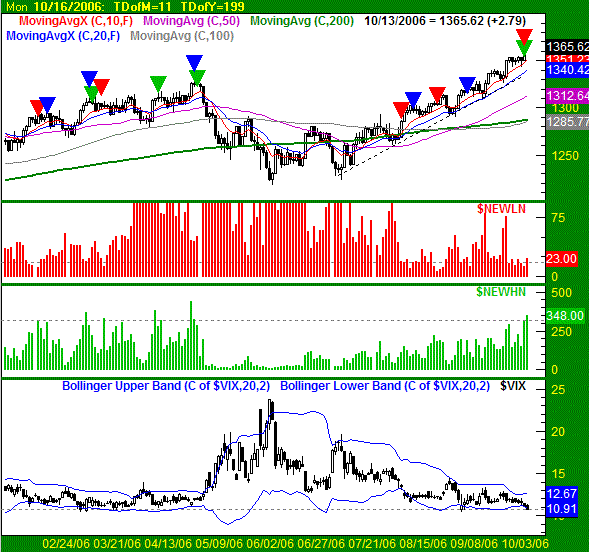
The S&P 500's close at 1365.20 on Friday was 2.75 points above Thursday's close - a gain of 0.20%. For the week, the SPX continued upward by 16.0 points, or 1.19% above last Friday's closing level. However, being way overbought, and with the VIX back to uncanny lows, we think the S&P 500's rocket-like rise in the last few days has given us a few hints of the uptrend's exhaustion.
We haven't looked at new high and new low data in a while, primarily because it hasn't been all that telling lately. That is, until now. As of last week, we saw new highs for NYSE-listed stocks as well as new lows for NYSE-listed stocks hit those extreme levels associated with tops and bottom. This extreme just happened to be consistent with a top, and is one of the major reasons we expect a pullback in the very near future.
On Friday, we saw 348 NYSE-listed stocks hit a new high. The day before, we saw 12 NYSE-listed stocks hit new lows. Very bullish? Yes indeed. That's the problem though...it may be too bullish. The last time we saw that many new highs was on May 5th - right before the gigantic pullback we suffered through this spring. Each extreme new high day is marked with a green arrow on the SPX's price bars.
The last time we saw that few news lows was August 31st, right before a minor pullback. We also saw tiny new low figures several times earlier this year, most of which came right on front of other minor pullbacks. Each extreme new low day is marked with a red arrow on the SPX's price bars.
To see both the new high and new low readings hit extremes simultaneously hints of a final, blowoff move. To see it occur at the same time the VIX is at almost-bizarre lows just makes a bearish reversal even that much more likely, as we've historically seen on our chart. Each instance of the VIX hitting an unusually sharp low is marked with a blue arrow on the SPX's price bars.
While we're still saying 'we're due', it's also worth keeping in mind that it could take a few days for any such dip to materialize. This coming week is expiration week, which brings it's on special brand of volatility. But, it's still imperative to keep an eye on al of these measures this week, including the key support and resistance lines we've discussed in earlier editions of this outlook.
S&P 500 Chart

Dow Jones Industrial Average Commentary
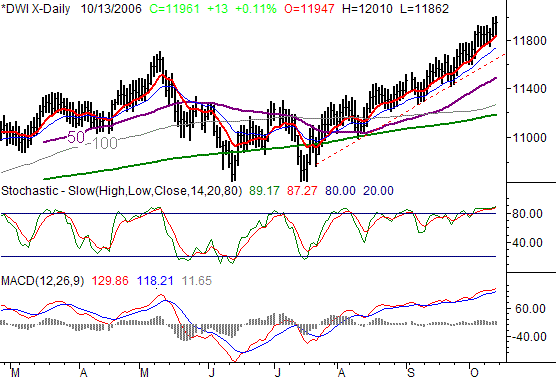
The Dow Jones Industrial Average gained 13 points on Friday, or 0.11%. However, it was still enough to count as a new all-time high close, at 11,961. Friday's high 12,010 was also a new all-time intra-day high. On a weekly basis, the Dow was 111 point, or 0.94% higher than last week's close. Despite the fact that this blue-chip index isn't quite as vulnerable as the other two indices, it's still teetering on a dangerous edge as well.
We're stochastically overbought (as all the indices are), which is potentially bearish. We're also finding support at the 10 and/or 20 day moving average line, as well as a long-term support line (red, dashed) that extends back to July. That support line is at 11,683 and rising fast, and even though we see a short-term dip in the works, for the Dow, only a slide under that support line would get us bearish in the bigger picture. Just keep some perspective, and keep watching these charts.
Dow Jones Industrial Average Chart

Price Headley is the founder and chief analyst of BigTrends.com.