NASDAQ COMMENTARY
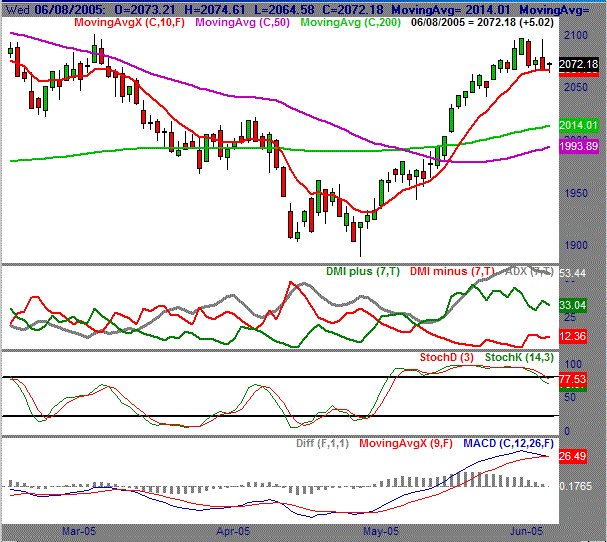
We'll be short and sweet today, as not a lot has really changed since last Friday's big fall. The NASDAQ closed last week at 2071.43, after the biggest one-day selloff in about three weeks. That move stunned some of the bulls who were certain that the big gains we saw in early May would continue for here to eternity. A little shell-shocked, these same traders weren't quite sure what to do, and the index has behaved accordingly. As of now, the composite is trading at 2072.18 - pretty much where it ended the previous week. We've seen trades above and below that level so far this week, but we're on the lower edge of that range (2064.58 to 2095.96) as this is being written.
Despite the stagnation, our analysis really hasn't changed from the Weekly Market Outlook. The composite had gotten a little ahead of itself, and now that problem is being solved. Even though there's been no real net change, the clues were still there, and there are even more bearish clues now.
Primarily, we see lower lows and lower highs as a sign that the pressure has turned from bullish to bearish. Over three of the last four sessions we've made lower lows, and (so far) we've also made lower highs in three of the last four sessions. This scenario is perfect for our DMI (Directional Movement Indicator) tool, which measures the change in highs and lows, as opposed to the closing price. The two DMI lines are just below the price bars on our chart. The bullish line (DMI+) is in green, while the bearish line (DMI-) is in red. The technical signal here is a cross of the two lines, but you can see how the two lines have been converging since late May. That crossover hasn't happened yet, so we can't technically turn bearish. However, the high-low trend looks like it's headed that direction.
Other technical sell signals include a bearish MACD crossunder, and a stochastic line cross under the 80 level. Neither of those technical bear signals was in place as of last Friday, although both of them were on the verge of being completed.
There is one last bastion of hope for the bulls - the 10 day moving average. The NASDAQ has found support there over the last three sessions. But even then, the index looks like it's going to keep pounding it down until it finally breaks. Note that the 10 day average is now pointing lower again. A close under the 10 day line would pretty much clinch the short-term bearishness we see everywhere else.
NASDAQ CHART

S&P 500 COMMENTARY
While the NASDAQ's trend looks like it's headed south, the S&P has actually done a mediocre job of treading water, preventing some of the technical damage that other indexes have already suffered. But even then, the S&P is facing some problems.
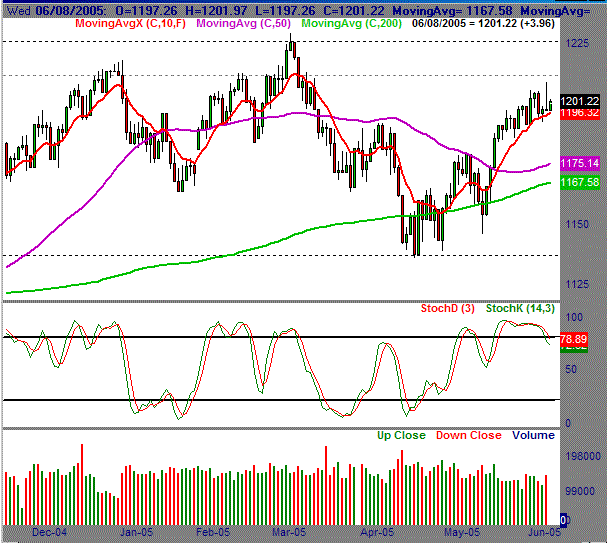
For starters, the SPX also has a stochastic sell signal, as of today. The official signal is a cross of both stochastic lines (%K and %D) back under the 80 'overbought' threshold. This occurred today. Although the S&P is actually ahead for the day, this doesn't change the signal. The other bearish hint comes form volume. Yesterday's slight loss was on higher volume. One could argue that with the market being basically flat, that volume was irrelevant. To a certain degree, that's true. But a look at the intra-day chart shows that the majority of yesterday's volume actually came late in the day - when all the selling occurred. In any case, the SPX has logged three distribution days on the last 10 sessions, and no accumulation days in that same timeframe. So, the buying interest we saw just a few weeks ago has already crumbled.
On the other hand, the S&P 500 continues to find support at its 10 day average as well. In fact, the 10 day line for this large-cap index is actually acting like support for a bigger bullish move. The NASDAQ's 10 day line only appears to be a nuisance for the bears, rather than a rally point for the bulls. With that in mind, any continued pullback in the market is probably going to be less harsh for the S&P 500, and a little more brutal for the NASDAQ.
In terms of a bigger picture, the marekt is still trapped in a range, so even a breakout or a breakdown wouldn't mean a whole lot. There's some resistance around 1212 where the S&P hit a top back in March, and then again at the most recent 52-week high of 1226. On the downside, support lies at this years low of 1137. None of these lines are really coming into play right now though. The near-term support is at the 10 day line, or 1196, and then again at 1175, where we find the 50 day line.
S&P 500 CHART

READER'S QUESTIONS
Q: Good morning: I found this to be really good info, my question is where might I find a free reading of the TRIN with a 12 day M/A so that i may watch this indicator?
A: We've not found a lot of resources that offer a tool to plot the moving average of TRIN. Our chart was made with Genesis' Trade Navigator (and excellent platform), and we know that TradeStation can do the same. Both are on the rather pricy end though, but may be worth it if you're really looking to use this chart. Yahoo offers a daily TRIN reading (look for "U.S. Indices"), but no history of it. However, you could record this date each day, and plot your own moving average in your own spreadsheet software. The best free resource we've found that provides TRIN history and also lets you plot a moving average is stockcharts.com. (Try a Google search for historical TRIN data - I'm sure you'll find other sources.)
Q: Noticed in the daily message you used a 12 day average of the Trin. The common average is a 10 day. That is what I see most quoted. Why do you use a 12 day instead of a common 10 day average?
A: We've just found the 12 day average to work better than the 10 day line. Both lead to similar results, but our software also offers an 'optimization' feature, where we can test different moving average lengths to find the one that leads to the highest success rate. We've always found the optimal timeframe to between 12 and 14 days. I also think that a 10 day average is the most common length because 10 days is the default setting for moving average in most trading software packages (it was in ours too). However, the defaults are rarely the best settings.
Price Headley is the founder and chief analyst of BigTrends.com.