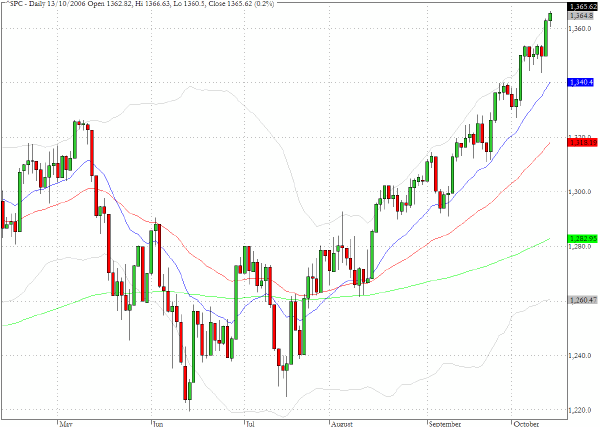
On an intraday basis the DJIA peeked above 12000 for the first time ever but the index was only able to achieve a 0.1% gain for the day on the close. The steep buy channels following the July lows continue to be the strongest feature of the chart patterns on the broad indices. The S&P 500 gained 1.2% over the course of last week but this was outshadowed by the 2.5% gains for both the Nasdaq Composite and Nasdaq 100.
Some kind of near term correction is to be expected but unless geopolitical concerns move to center stage the remarkably positive view of the underlying macro economy should keep a firm bid under the market at least until the elections are behind us.
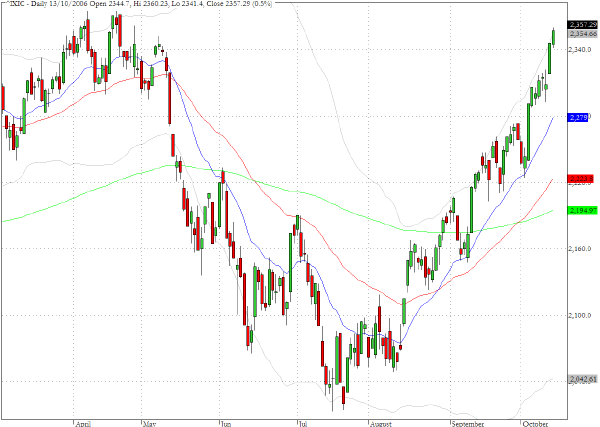
The Nasdaq Composite index (^IXIC) closed Friday at 2357 which is just thirteen points below the recent multi-year high of 2370 achieved on April 19. On a weekly basis the close was the highest since early 2001.
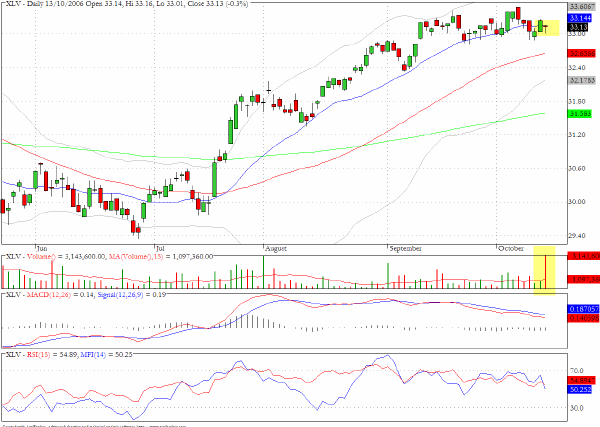
The ETF four the health care sector, XLV, is showing some signs of incipient corrective behavior. Friday√Ę‚,¨‚"Ęs volume was three times the moving average and the recent price action has been accompanied by fading momentum and distribution.
TRADE OPPORTUNITIES/SETUPS FOR MONDAY OCTOBER 16, 2006
The patterns identified below should be considered as indicative of eventual price direction in forthcoming trading sessions. None of these setups should be seen as specifically opportune for the current trading session.
Harley Davidson (HOG) is demonstrating some increasing intraday volatility in the vicinity of $65.

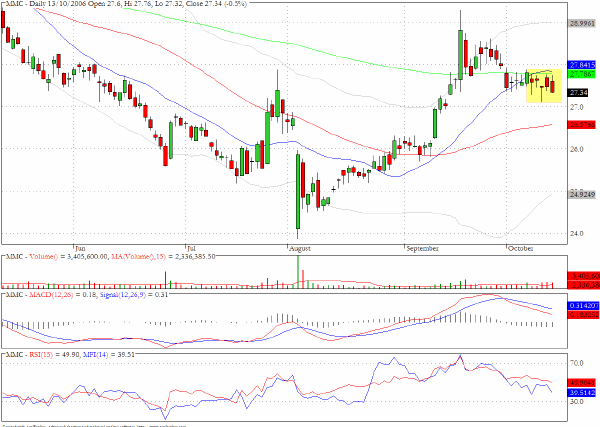
Marsh and McLennan (MMC) was unable to rise above the 200- and 20-day EMA's during last week's trading and may be headed towards $26.
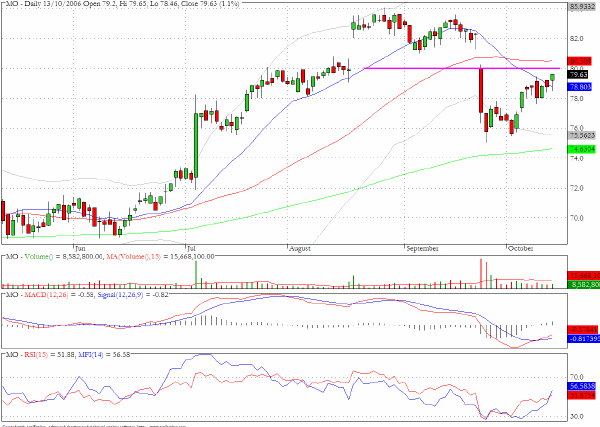
Altria Group (MO) has rallied back towards $80 from the recent steep drop and may run into further liquidation.
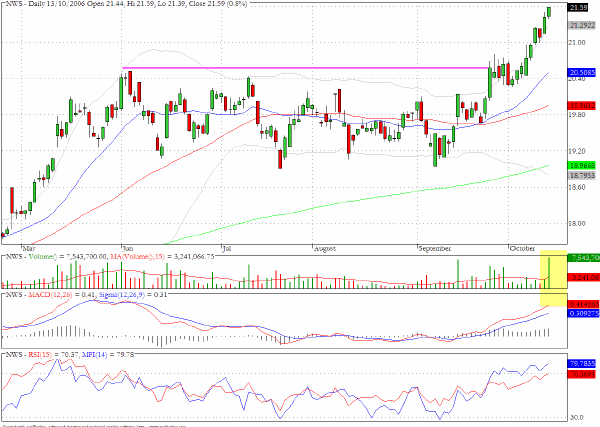
As we have commented before News Corporation (NWS) is showing further strength following its recent price breakout. Friday's volume underlines the positive momentum.
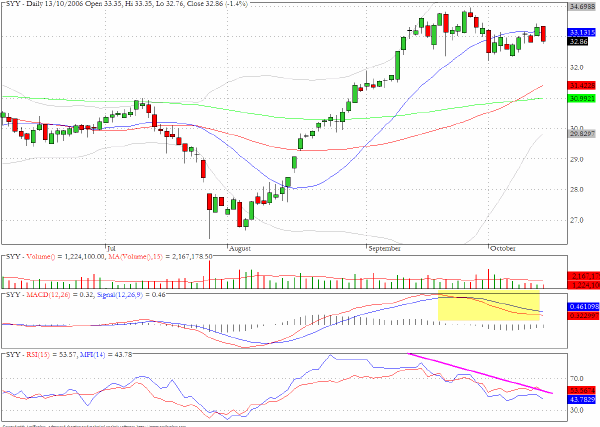
Sysco (SYY) has quite noticeable negative divergences.
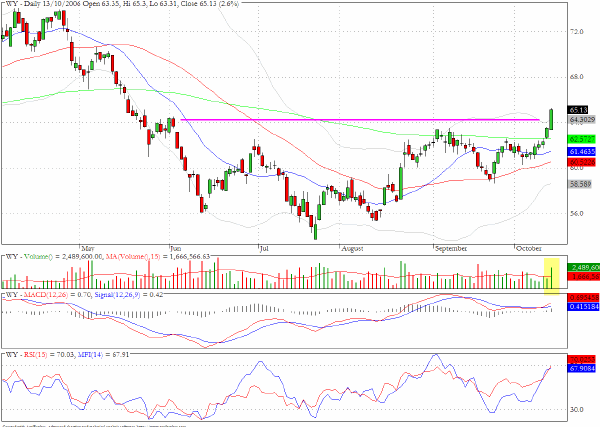
Weyerhauser (WY) broke out on heavy volume on Friday from the range that has confined it since late May
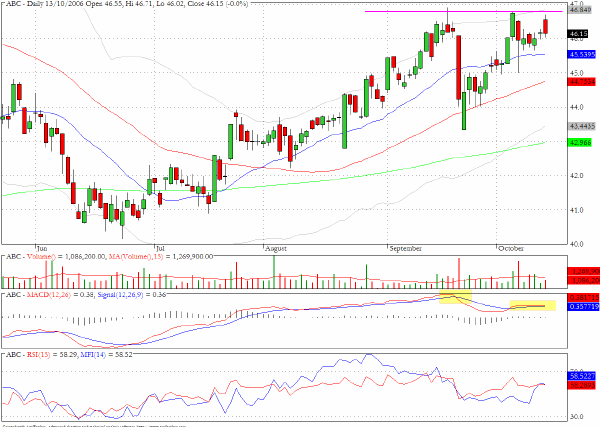
Amerisource Bergen (ABC) has been turned back three times as it tried to break above $47.
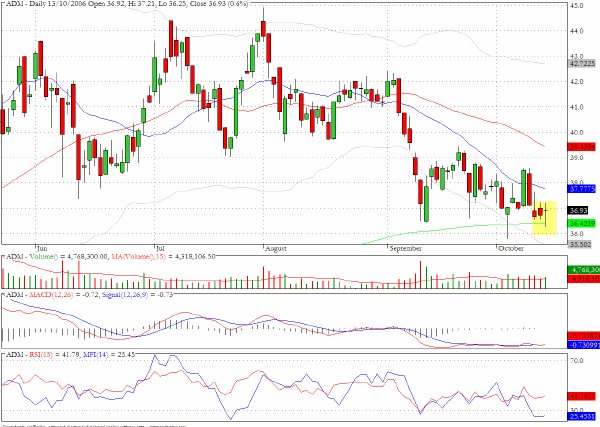
Archer Daniels Midland (ADM) recorded a Doji candlestick in conjunction with the 200-day exponential moving average and may be ready to attempt a recovery effort back towards the 50-day EMA.
Clive Corcoran is the publisher of TradeWithForm.com, which provides daily analysis and commentary on the US stock market. He specializes in market neutral investing and and is currently working on a book about the benefits of trading with long/short strategies, which is scheduled for publication later this year.
Disclaimer
The purpose of this article is to offer you the chance to review the trading methodology, risk reduction strategies and portfolio construction techniques described at tradewithform.com. There is no guarantee that the trading strategies advocated will be profitable. Moreover, there is a risk that following these strategies will lead to loss of capital. Past results are no guarante of future results. Trading stocks and CFD's can yield large rewards, but also has large potential risks. Trading with leverage can be especially risky. You should be fully aware of the risks of trading in the capital markets. You are strongly advised not to trade with capital.