With the domestic (U.S.) market going through a major shake-up right now following the best four week period we've seen in months, we're forced to go overseas to find less volatile opportunities. We'll return to North American sectors once we get past all this turbulence and complete this correction, but for today, we're revisiting Australia.
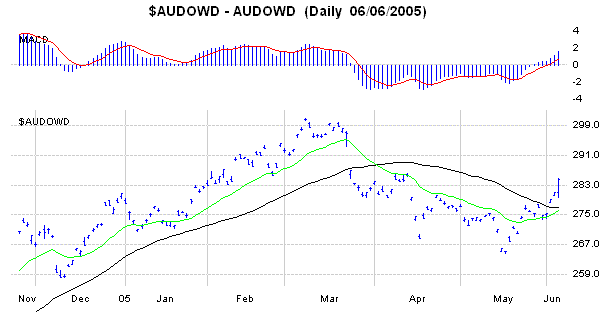
We actually highlighted this bullish chart months ago when the Dow Jones Australian Index (AUDOWD) was at 265.57. At that point in time, the index had been through a a very strong runup, and rather than buy at that likely top, we recommended waiting for a dip before taking on a long position. A few days later (12/8/2004) we got that very pullback, when the index fell back to 258. The index found support there near the 50 day line, and then made a strong bounce and continued to move toward our target price of 305. The index traded as high as 300 in March of this year (just 5 points shy of our target) before pulling back under the 13 week line on March 23rd. That was our exit signal, but that still meant a nice 20 point gain for the four month holding period.
The reason we wanted to recap that previous trade was to describe what may be in the works again. The Australian Index fell with U.S. markets between March and May, but with the move back above the 20 and 50 day moving averages - and the support at the 200 day line (not shown on the daily chart) - it looks like this particular market is poised for another round of bullishness. And this time, we're getting in much earlier. We're going to set a target of 324 for the Dow Jones Australian Index. That 14 percent may seem lofty, but that's only about half as big as its previous bullish move from September of last year to March of this year. So, it's well within reach. As for stops on this bullish bias, a close under the 50 day line would negate this optimistic opinion. It's currently at 277.
The tough part here is finding a way to take advantage of this bullishness. There are only a limited number of Australian ADRs - certainly not enough to constitute a complete position in a foreign market. There is an iShares exchange traded fund (EWA), and there are a few country-based mutual funds that may also work.
Dow Jones Australian Index (AUDOWD) - daily

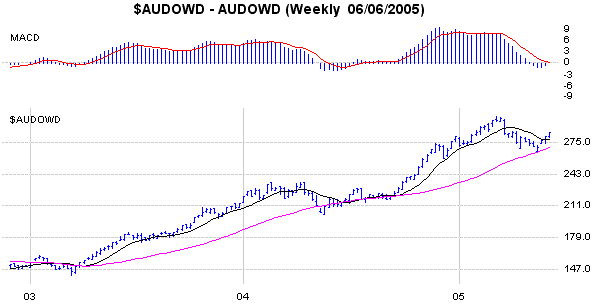
On the weekly chart you can really get a feel for how strong this market has been, and why this current dip is a major opportunity. The black line is a 50 day (10 week) moving average, while the pink line is the 200 day (40 week) moving average. Both have been support in recent months, and the crosses above them have historically signaled big moves.
Dow Jones Australian Index (AUDOWD) - weekly

Price Headley is the founder and chief analyst of BigTrends.com.