Following Monday's tiny range Doji candlestick the Nasdaq 100 index (^NDX) gapped down on the open and finished the day with a one percent decline. Allegedly equity traders were spooked by the inflationary implications of the PPI data, but this doesn't seem to have rattled Treasury traders. As we suggested, the indices have reached levels where ambushes by the bears are likely to cause quick retreats, but whether the underlying sentiment can be shaken will hinge largely on the flow of earnings and macro-economic data.

The formation for the S&P 500 (^SPC) shows the long lower shadow which characterized much of yesterday's market action. Despite the sell-off early in the session there was an absence of sustained liquidation and the index concluded the session with a modest 0.4% retreat. Today's CPI data could, if it surprises, lead to a rerun of yesterday morning's slump but it will be worth gauging the extent of any possible decline by observing the reaction in the bond market.

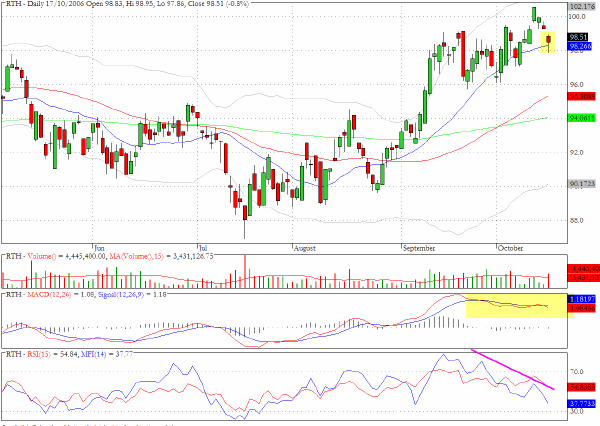
The retail sector fund, RTH, is experiencing gaps and increased intraday volatility while the background momentum and money flow are deteriorating.
TRADE OPPORTUNITIES/SETUPS FOR WEDNESDAY OCTOBER 18, 2006
The patterns identified below should be considered as indicative of eventual price direction in forthcoming trading sessions. None of these setups should be seen as specifically opportune for the current trading session.
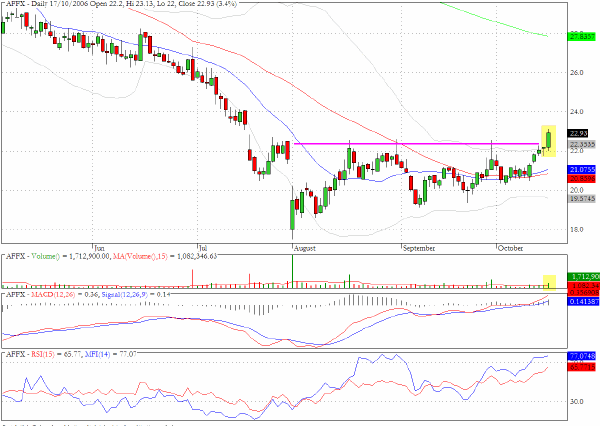
Affymetrix (AFFX) moved up more than three percent on above average volume and appears to have broken through the range that has been in place since mid July.
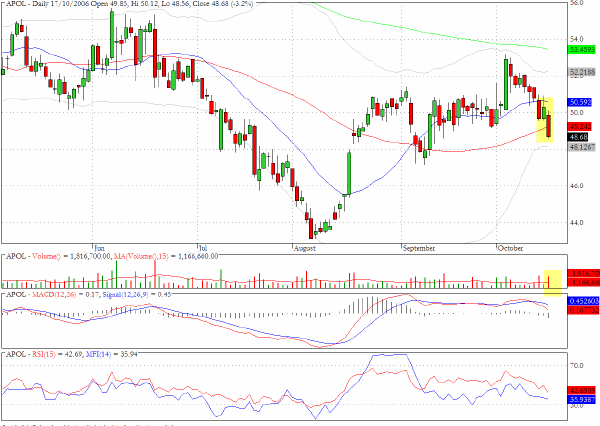
Apollo Group (APOL) moved down by more than three percent on substantial volume and closed below the 50-day EMA.
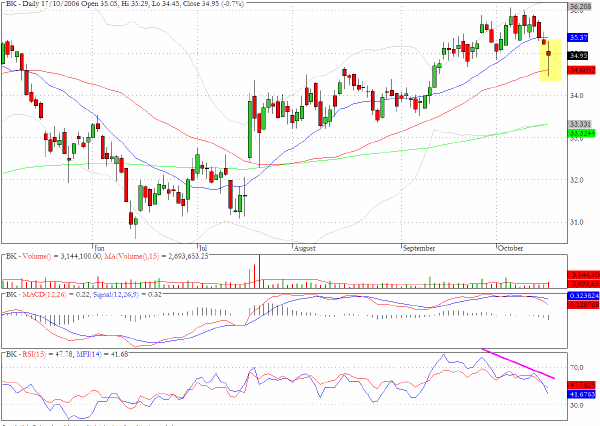
Bank Of New York (BK) is one of a number of banks that have run into overhead resistance. Yesterday's striking Doji formation with an intraday low that pierced the 50-day EMA suggests that further nervousness and volatility are to be expected.
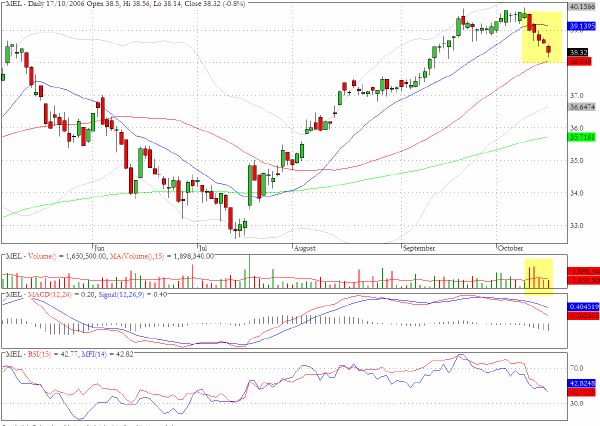
Mellon Financial (MEL) has declined for the last five sessions and now needs to test whether the 50-day EMA will lend support or not.
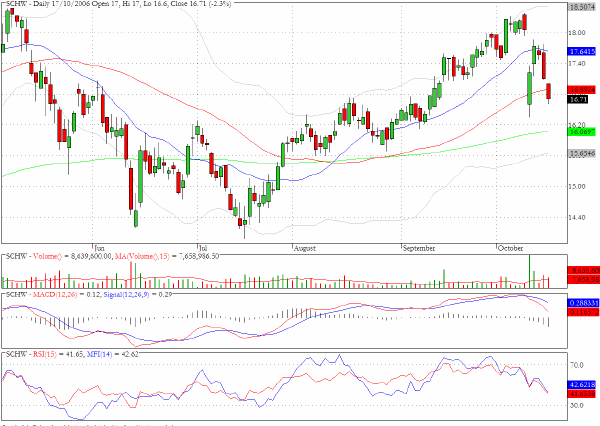
The chart for Schwab (SCHW) is showing range expansion and some further evidence that a correction may be under way.
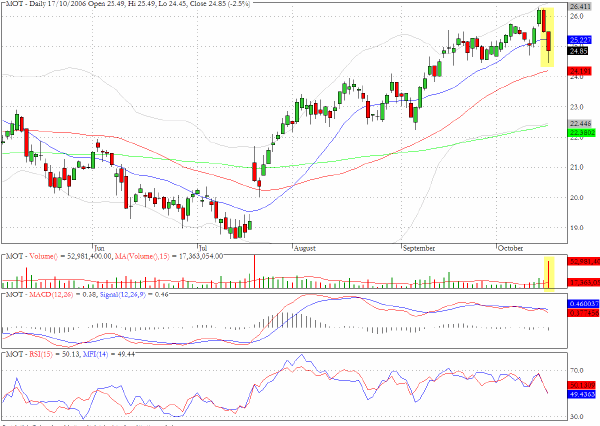
Motorola (MOT) continued to move downwards following Monday's reversal and finished a heavy volume session below the 20-day EMA.
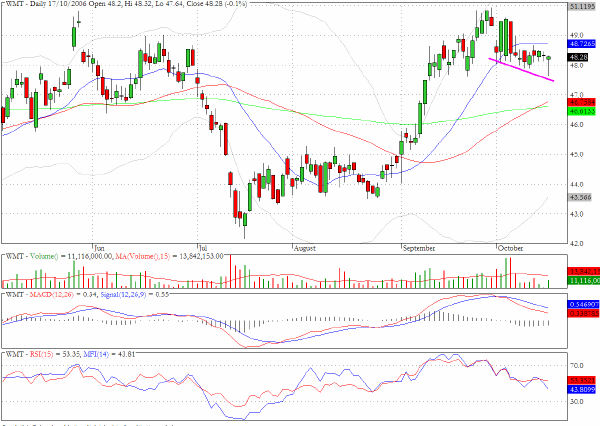
Wal-Mart (WMT) has registered a succession of lower lows in recent sessions but the $47 level, just below yesterday's close, could prove to be an area of near term support.
Clive Corcoran is the publisher of TradeWithForm.com, which provides daily analysis and commentary on the US stock market. He specializes in market neutral investing and and is currently working on a book about the benefits of trading with long/short strategies, which is scheduled for publication later this year.
Disclaimer
The purpose of this article is to offer you the chance to review the trading methodology, risk reduction strategies and portfolio construction techniques described at tradewithform.com. There is no guarantee that the trading strategies advocated will be profitable. Moreover, there is a risk that following these strategies will lead to loss of capital. Past results are no guarante of future results. Trading stocks and CFD's can yield large rewards, but also has large potential risks. Trading with leverage can be especially risky. You should be fully aware of the risks of trading in the capital markets. You are strongly advised not to trade with capital.