NASDAQ Commentary
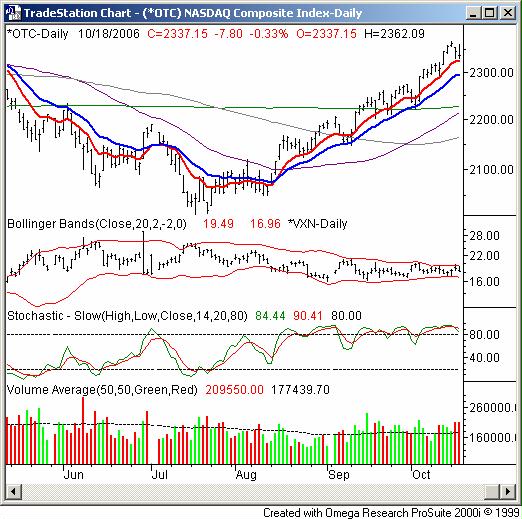
The NASDAQ Composite fell 7.8 points on Wednesday (-0.33%) to close at 2337.15....the only major index to end the day in the red. For the week so far, the composite is in the hold by 20.14 points (-0.85%) thanks to a rather weak Tuesday in fron of Wednesday's dip. While any loss is a bearish sign, the biggest worry the bulls should note here is that selling on Tuesday and Wednesday were also the highest volume days we'd seen in the last couple of weeks.
What's bullish? Even with the last couple of weak days, the 10 day line still hasn't cracked as support. It's currently at 2326, and unless it breaks, any other bearish discussion is moot. Even then, the 20 day line has been proven as support just as often. It's at 2297 now.
Plus, the VXN - as unbelievable as it seems - remains at its uncanny low levels. We still contend that we'll pay the price eventually, but not yet.
What's bearish? The shape of Wednesday's bar, for one thing. The open and the close were both near the low for the day - a sign that the early 'dumb' money and the late 'smart' money were both on the same bearish page for the day (one of the rare instances of where their agreement points to the common conclusion relatively likely).
Plus, both of the stochastic lines are now headed lower...still above the 80 'overbought' threshold, but pointed lower all the same. When/if both lines fall under 80, the sell signal will be official.
And as we mentioned, there was an awful lot of bearish volume the last couple of days. Maybe it was expiration inspired, or maybe not - doesn't really matter. If enough technical damage is inflicted on the chart this week, the reason won't be take into consideration...only the result and effect will matter. Plus, with the VXN positioned to move from low to high - sometime - the NASDAQ's vulnerability still favors the downside trade, rather than a bullish continuation.
NASDAQ Chart

S&P 500 Commentary
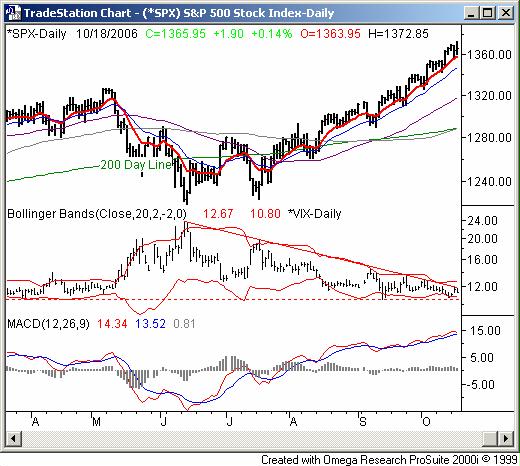
The S&P 500's found 1.9 points by the time Wednesday's closing bell rang...a gain of 0.14%. The close at 1365.95 is a mere 0.35 points (0.03%) above Friday's close, which is close enough for us to call a break-even. While the bears have a slightly better argument with the SPX than they did at this time last week, from a technical perspective, the bulls still (stunningly) have a valid case too.
What's bullish? Basically, the same things that are bullish with the NASDAQ's chart...support at the 10 day average, and a low VIX that's content to stay low, and with some help from a long-term resistance line, even move lower. The 10 day line is at 1358, while the 20 day average is at 1347. Until both break, don't second-guess the trend. Oh yeah, we hit a new high for the year on Wednesday.
What's bearish? Again like the NASDAQ's chart, the low VIX means we'll be paying the price eventually - the question is just one of when. Also, though we're not quite there yet, we appear to be on the verge of a MACD cross-under.
Be patient here. It's expiration week, so anything could happen Thursday and Friday. We're far more interested in seeing what happens on Monday or Tuesday, when we can be sure expiration pressures aren't a problem.
S&P 500 Chart

Dow Jones Industrial Average Commentary
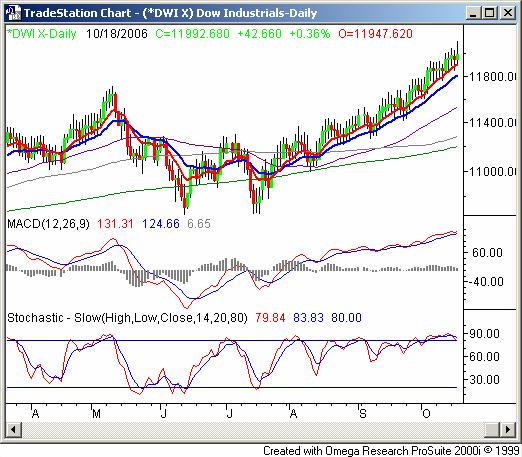
The Dow Jones Industrial Average closed at 11992.68 on Wednesday, following the gain of 42.66 points (0.36%). That close is only 32.17 points above Friday's close (0.27%) though, meaning all of the weekly gains can be chalked up to Wednesday's miniscule gain. On the flipside, the Dow still managed to hit a new all-time high on Wednesday - for the third straight day. And, it's no secret, that the Dow touched that psychologically-critical 12,000 mark. Now let's see if the Dow can keep working past it. As it stands right now, it looks a bit like the sellers were using the benchmark as a sell trigger.
We're not even going to discuss the Dow's nuances...we already explained them twice above. Just keep an eye on the 10 day line at 11,905, and the 20 day line at 11,805. The MACD lines are on the verge of a cross-under, as the stochastic lines are on the verge of falling under 80. While the trend is your friend, at this point, we have to rationally apply reason. The odds are now starting to favor at least a cooling of this uptrend.
Dow Jones Industrial Average Chart

Price Headley is the founder and chief analyst of BigTrends.com.