NASDAQ Commentary
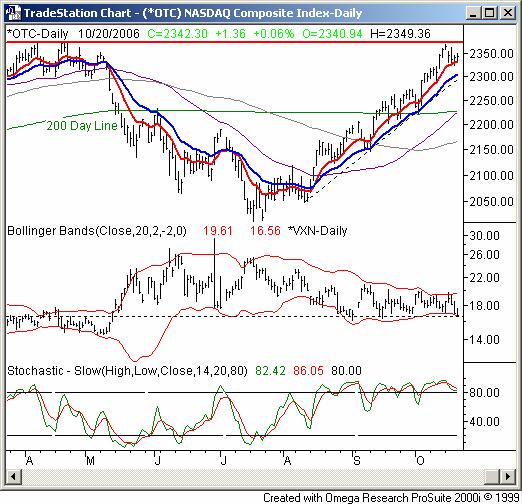
The NASDAQ's 0.06% gain on Friday was the most tame of all three indices we watch here, as the composite only gained 1.36 points to end the session at 2342.30. That still means a negative close for the week though. The index closed 14.99 points (-0.64%) lower than the previous Friday's close, perhaps finally pointing to the bigger-picture weakness we've been discussing lately.
Although the composite didn't crack this year's high of 2375, Monday's peak of 2368.11 was pretty close. The question is, was it close enough to satisfy any of the would-be sellers who were just waiting for the optimal spot to make an exit? Or, will these folks need to officially see 2375 before they take profits....if they're even interested in taking profits.
While only the coming week can really answer the question, based on the response we saw after Monday, we tend to think the answer is the 'close enough' answer. Things turned bearish pretty harshly on Tuesday, and after we closed the bearish Monday/Tuesday gap, we sank back to the lower end of last week's range, never really looking back.
True, it was an expiration week, so any read we're getting now may be a bit tainted. However, the heart of the problems were already in place before expiration week came. The NASDAQ is still overbought, and the VXN is still strangely low. And, our contention is still that there's a price to be paid.
On the flipside, from here, it's clear the buyers are using the 10 and/or 20 day moving average lines as a buying point. The former is at 2331, while the latter is at 2305. Unless those lines actually breakdown as support, we'll actually have to stay sided with the uptrend, as unlikely as it seems. If 2375 is breached, it could also be a bullish catalyst.
NASDAQ Chart

S&P 500 Commentary
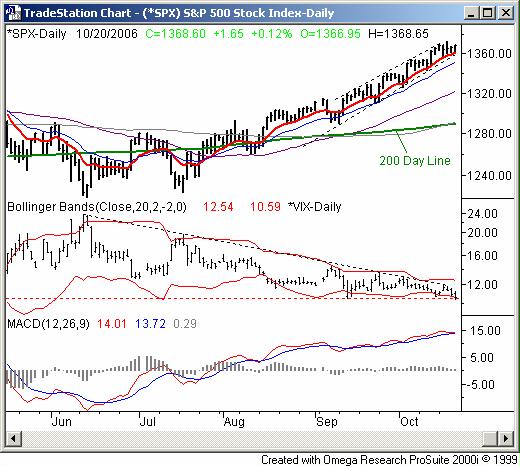
The S&P 500's close at 1368.60 on Friday was 1.65 points (+0.12%) above Thursday's close. For the week, the large-cap index just gained 3.0 points, or 0.22%. However, the support we've been seeing here is still unwavering.
As it has since July, the SPX has made its way through a generally bullish trading zone, thanks to some help from its 10 day moving average and 20 day moving average. Despite the worries that they wouldn't, all of the SPX's support lines have continued to keep the index drifting higher.
So, as we've been prescribing for weeks, be aware of the potential breakdown from any (actually, all) of those lines. The lowest of them is the 20 day line (blue), currently at 1351, and rising. That also coincides with the long-term support line (dashed) extending back to July. Both of those lines are rising about 2 points per day, so be sure to adjust accordingly.
In the meantime, the VIX is back to the lower Bollinger band, and closed at a multi-month low close of 10.63 on Friday. While we have little doubt that expiration played at least some role in getting the VIX to these dangerous levels, don't forget that this issue was one well before expiration week was here. It's only a question of time before the VIX bounces (sharply) at the expense of stocks. We remain vigilant in our watch.
On a side note, the S&P 500 is now 6% above its 200 day line. Historically speaking, it's a statistical rarity, and yet another bearish concern. The 'reversion to the mean' theory usually kicks in right about here. In fact, there's only one instance in the last two years (December of 2004) when the SPX got significantly greater than 6% above the 200 day moving average. All of them, including the December '04 instance, led to correction of 2% or so, if not greater. The research on this scenario so far is limited, but the concern for the bulls is still obviously merited. We'll keep working on it to bring you the vital stats of the premise later this week.
S&P 500 Chart

Dow Jones Industrial Average Commentary
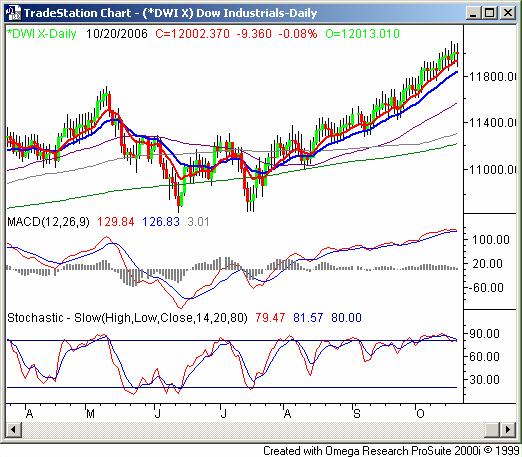
The Dow closed just 9.36 points lower on Friday, for a negligible loss of 0.08%. Ending the week at 12,002.37 meant a 0.35% gain above the prior Friday's close, translating into a gain of 0.35% on a weekly basis.
The duality of the situation applies to the Dow as well. Things are bullish in the sense of upward momentum. But, things are increasingly bearish in the sense of being overbought, and hinting at correcting that condition. We have yet to see either, but we're on the verge of a MACD crossunder as well as a stochastic sell signal. Only a little weakness this coming week would prompt both.
That being said, the 20-day line - no matter what - at 11,848 is still the line in the sand.
Dow Jones Industrial Average Chart

Price Headley is the founder and chief analyst of BigTrends.com.